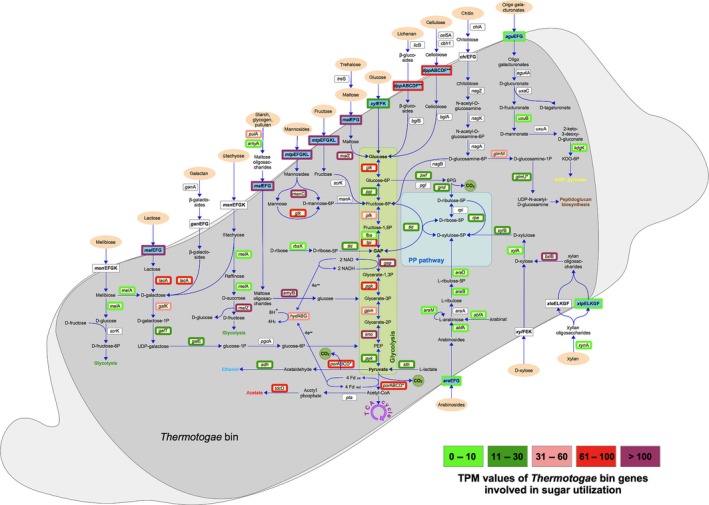
Figure 1.

Metabolic reconstruction of sugar utilization pathways in the Thermotogae genome bin and transcript per million (TPM) values for genes encoding involved proteins. Figure modified according to Maus et al. (2016). Carbohydrates are labelled in light orange ovals, transporters in blue and corresponding genes in yellow rectangles. White rectangles represent genes lacking in the genome bin in comparison with its reference strain Defluviitoga tunisiensis L3. Frames indicate the category of TPM values for the respective gene, the five categories explained on the bottom right. The glycolysis and the pentose phosphate pathways are highlighted in green and blue, respectively. Abbreviations: CO 2, carbon dioxide; GAP, glyceraldehyde‐3‐phosphate; KDG‐6P, 2‐keto‐3‐deoxy‐d‐gluconase‐6‐phosphate.
