Figure 2.

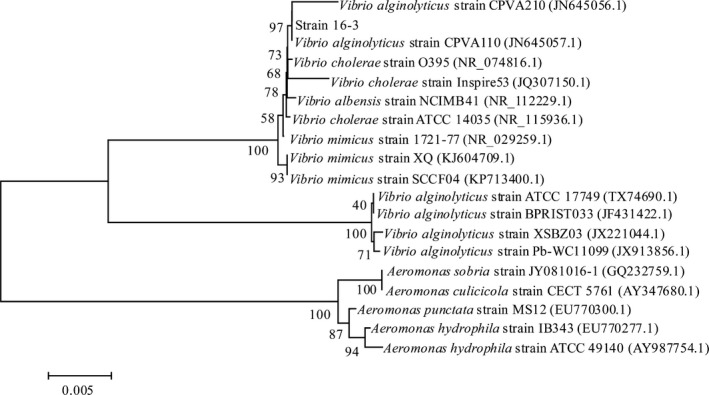
Phylogenetic tree based on 16S rRNA gene sequence of the strain 16‐3. The scale bar represents 0.005 substitutions per nucleotide position. The number at each branch points represents the bootstrap confidence value of the 1,000 repeated

Phylogenetic tree based on 16S rRNA gene sequence of the strain 16‐3. The scale bar represents 0.005 substitutions per nucleotide position. The number at each branch points represents the bootstrap confidence value of the 1,000 repeated