
Figure 6.
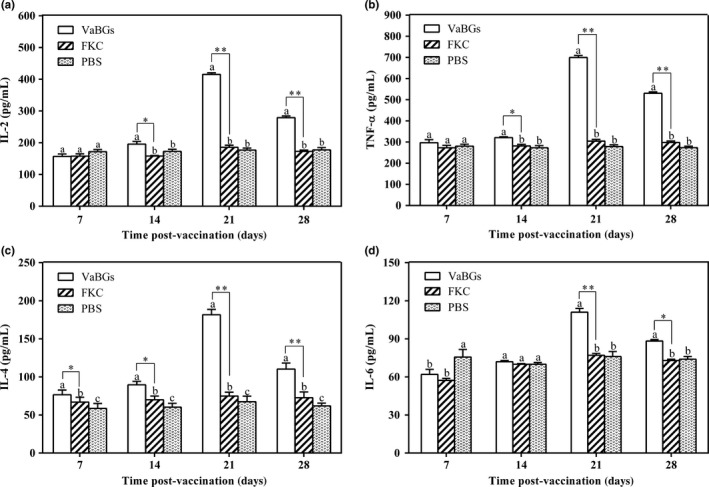
Serum cytokine levels in immunized mice detected by double‐antibody sandwich ELISA. Values presented as mean±SD, n = 3. Bars represent standard deviations. Different letters (a, b, c) on the bar indicate significant differences among different groups at the same time point. *p < .05, **p < .01 (VaBGs group versus FKC group)