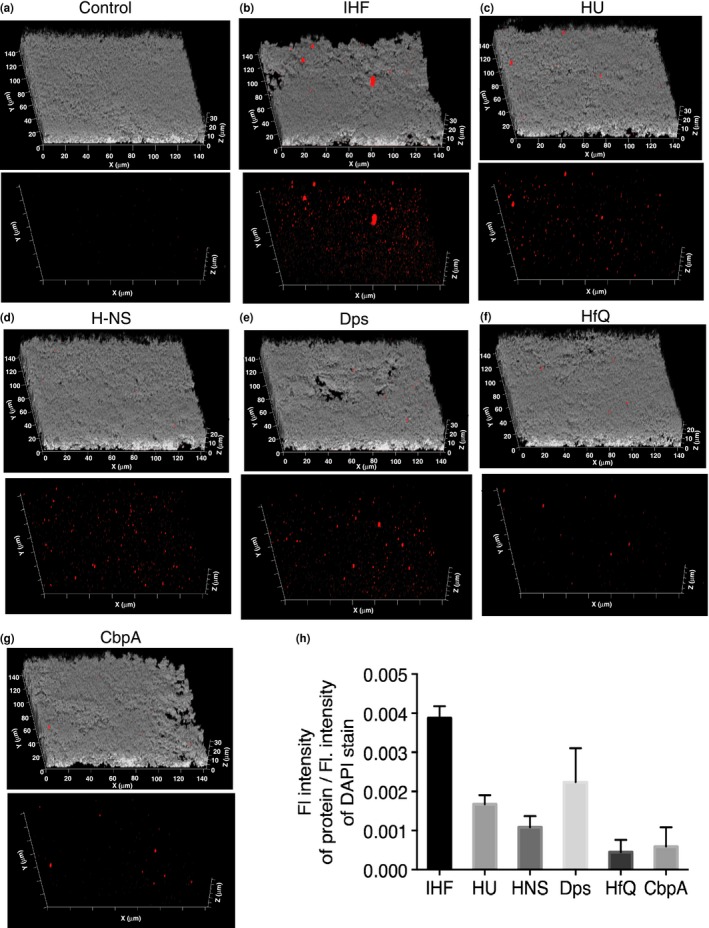
Figure 1.

Distribution of NAPs within the ECM of an NTHI biofilm. Biofilm growth was initiated then maintained for 40 hr. Unfixed 40 hr biofilms were incubated with (a) control preimmune IgG (b) anti‐IHF IgG (c) anti‐HU IgG (d) anti‐H‐NS IgG (e) anti‐Dps IgG (f) anti‐HfQ IgG (g) anti‐CbpA IgG and then incubated with goat anti‐rabbit IgG conjugated to AlexaFluor® 594 (NAPs ‐ red). NTHI were stained with DAPI (gray). The biofilms were then imaged using a 63X objective on a Zeiss 510 Meta‐laser scanning confocal microscope. Images represent the side view of biofilms. Bottom panel in each image set shows the distribution of NAPs in the absence of gray. (h) The relative intensity of NAPs was determined by the ratio of protein (red) to DAPI (gray). The biofilm assays were repeated a minimum of three times on separate days. Data are presented as mean values ± standard error of the mean. Note that all tested NAPs including IHF, HU, H‐NS, HfQ, Dps and CbpA are present within the ECM of biofilms formed by NTHI, albeit at different relative concentrations. ECM, extracellular matrix; NAP, nucleoid associated proteins
