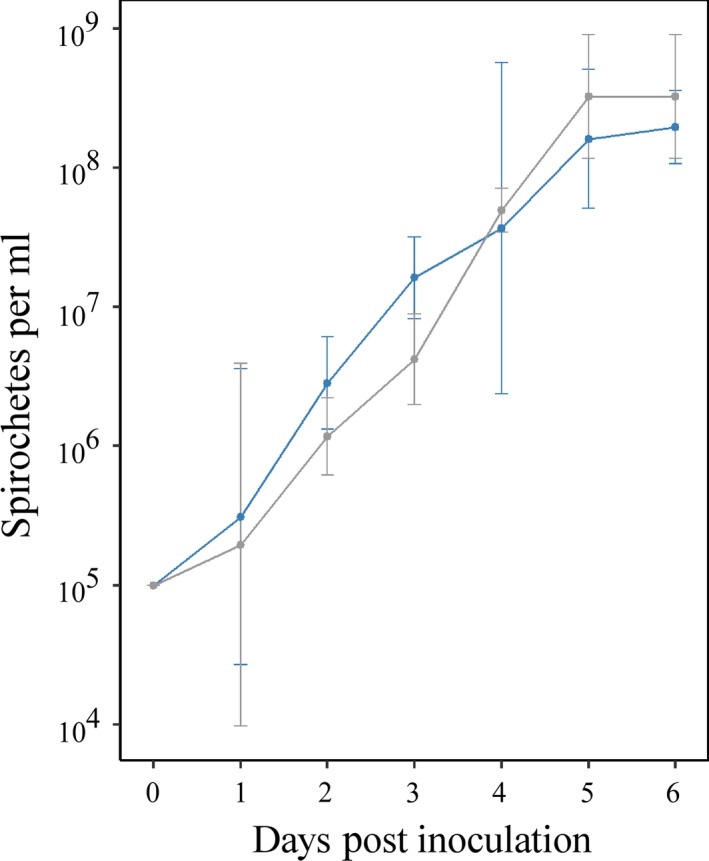
Figure 2.

In vitro growth curves of wild‐type Borrelia hermsii and BhΔvmp Ex. Wild‐type B. hermsii is shown in gray; BhΔvmp Ex is shown in blue. No significant differences in growth rate (p = .37) or maximum cell density (p = .17), as determined by linear regression analysis of the slopes and analysis of variance, respectively, were detected between Bh∆vmp Ex and wild‐type B. hermsii (p > 0.05). The mean and 95% confidence intervals (bars) of triplicate measurements at each time point are plotted
