
Figure 4.
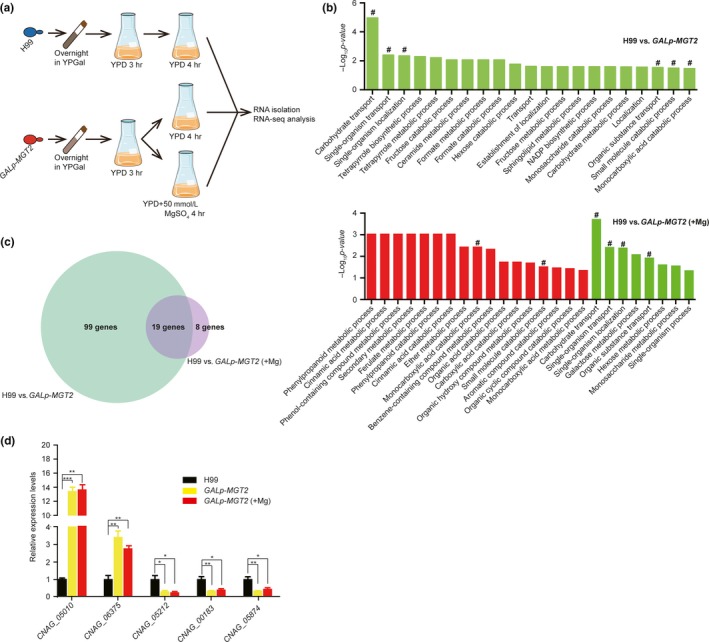
Transcriptomic analysis of the Gal7p‐MGT2 strain. (a) Strategy for performing the transcriptomic analysis on wild‐type and GAL7p‐MGT2 strains. Overnight YPGal cultures were diluted to an A 600 of 1.0 in YPD medium. The YPD cultures were incubated at 30°C for 3 hr to repress the activity of the GAL7 promoter in the GAL7p‐MGT2 strain. For the GAL7p‐MGT2 strain, the YPD culture was divided in two, and MgSO4 was added into one portion at a final concentration of 50 mmol/L. All cultures were incubated for additional 4 hr before RNA was isolated. Three biological replicates were carried out. B Gene ontology analysis. Gene ontology was performed using TopGO (Huber et al., 2015). GO terms were downloaded at http://www.bioconductor.org/packages/release/bioc/html/topGO.html. Significantly altered GO terms (classical fisher test, p < .05) are shown on the plot. Red bars indicate upregulation in the GAL7p‐MGT2 strain and green bars indicate downregulation in the GAL7p‐MGT2 strain. Hash signs show the unchanged GO terms after Mg treatment. (c) Venn diagram for transcriptomic analysis. Repressing MGT2 causes 118 genes to be differentially expressed compared to the wild‐type strain H99. Repressing MGT2 in the presence of exogenous Mg causes 27 genes to be differentially expressed compared to the wild‐type strain H99. Nineteen genes demonstrated similar expression dynamics in both growth conditions. (d) Real‐time PCR confirmation of transcriptomic data. Cells were grown as described in Figure 4a, and RNA was isolated, digested with DNase I, and reverse‐transcribed. Random genes were selected from 19 overlapping genes. Primers are listed in Table S1. Actin was used as a normalization control. Three biological replicates were performed. The Student's t‐test was performed to determine statistical significance (***p < .005, **p < .01, *p < .05).