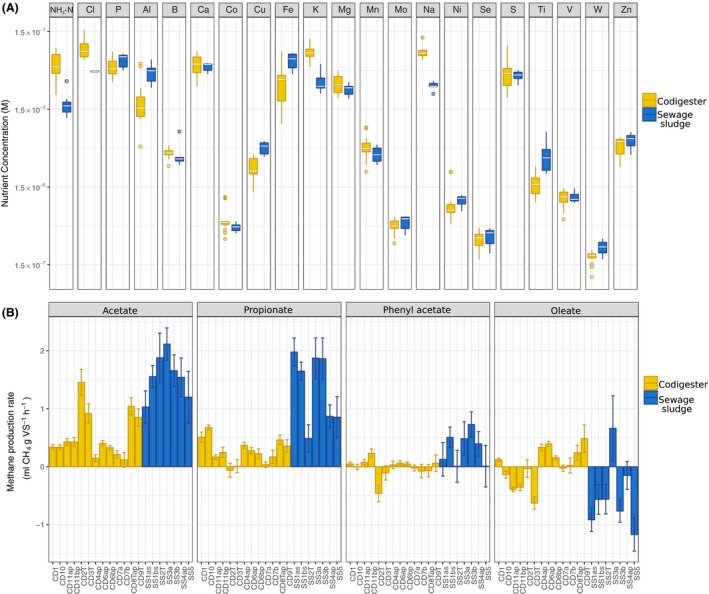
Figure 1.

A. Box plot illustrating average concentrations of the measured elements in the codigesters and sludge digesters.
B. Maximum methane production rates (R m) from batch assays with acetate, propionate, phenyl acetate and oleate with all digester contents determined via fitting Gompertz models to methane production curves. R m values refer to standard temperature and pressure. Error bars indicate the standard errors for R m using the nonlinear regression analysis.
