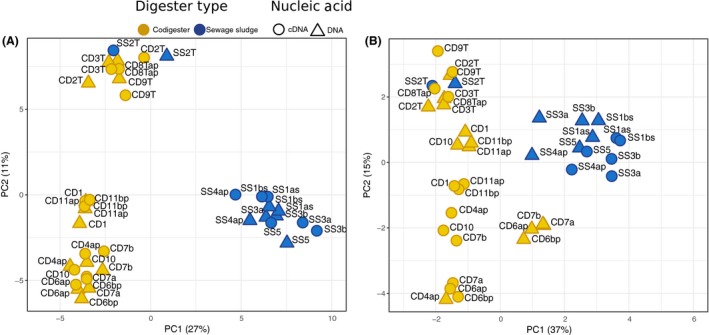
Figure 2.

Principal components analysis (PCA) plots of (A) Bacteria and (B) Archaea OTU read counts after variance stabilizing transformation with DESeq2 (Love et al., 2014). Points are shown for both rRNA gene (DNA) and rRNA (RNA) samples for each digester. Values in parentheses represent the fraction of the total variance explained by each PC axis.
