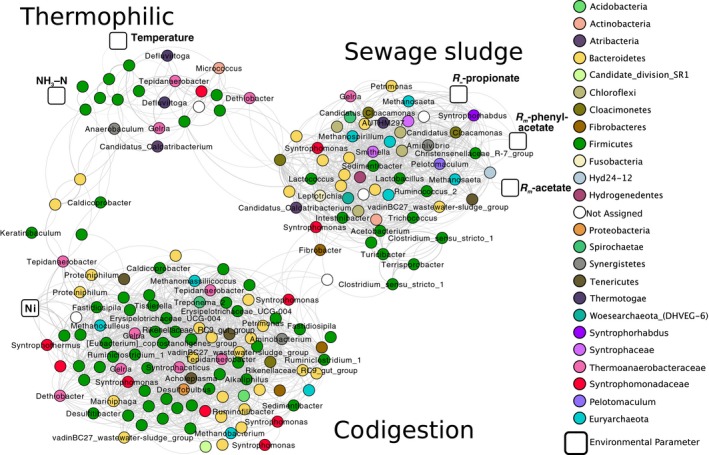
Figure 5.

Co‐occurrence network based on correlation of OTU read counts in 16S rRNA gene expression profiles across the 20 full‐scale anaerobic digesters. Nodes are coloured by taxonomy with labelled genera names when possible, and edges are shown as grey lines. The thickness of the edge is proportional to the r value of the correlation (from 0.8 to 0.99). Syntrophic bacteria groups and archaeal groups are depicted in pinks/reds and turquoise respectively. Boxed nodes represent environmental parameters.
