
FIGURE 2.
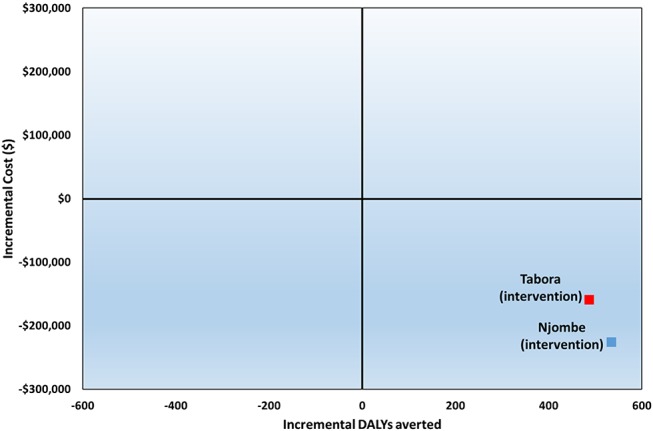
Incremental cost-effectiveness plane. The 2 squares denote the ICERs for both study regions. Their position in the South-East quadrant suggests that the intervention dominates the control because it is both less costly and more effective.
Official websites use .gov
A
.gov website belongs to an official
government organization in the United States.
Secure .gov websites use HTTPS
A lock (
) or https:// means you've safely
connected to the .gov website. Share sensitive
information only on official, secure websites.
Incremental cost-effectiveness plane. The 2 squares denote the ICERs for both study regions. Their position in the South-East quadrant suggests that the intervention dominates the control because it is both less costly and more effective.