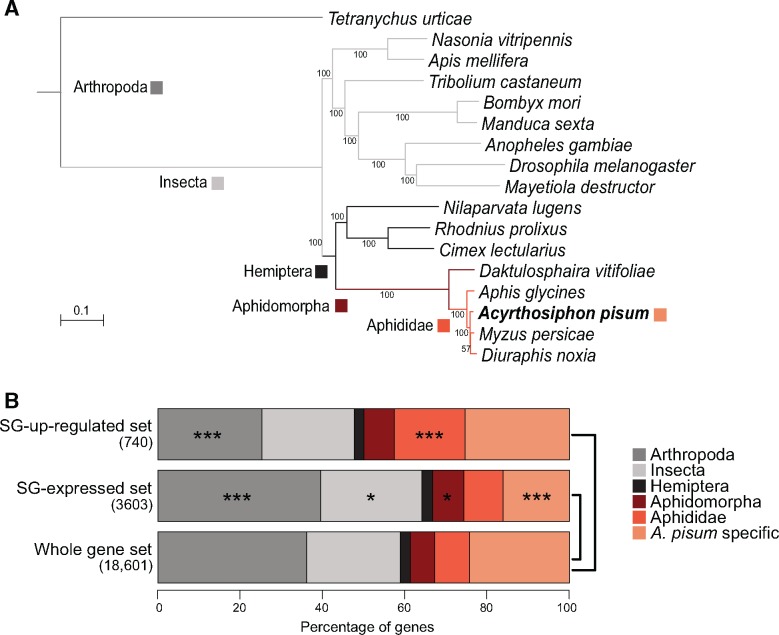
Fig. 2.
—Orthology profile of Acyrthosiphon pisum SG effector candidate gene sets (478 single-copy ortholog groups). (A) Phylogeny of the 17 arthropod species analyzed to determine ortholog groups. The colored squares indicate the levels of orthology, as indicated on the bottom right-hand legend. (B) Proportions of the different orthology levels among genes of the salivary effector sets and the A. pisum genome. Stars indicate the significance of differences in the proportion of genes presenting a given orthology level between a given effector set and the whole gene set (hypergeometric test): *P < 0.05, ***P < 0.001.

