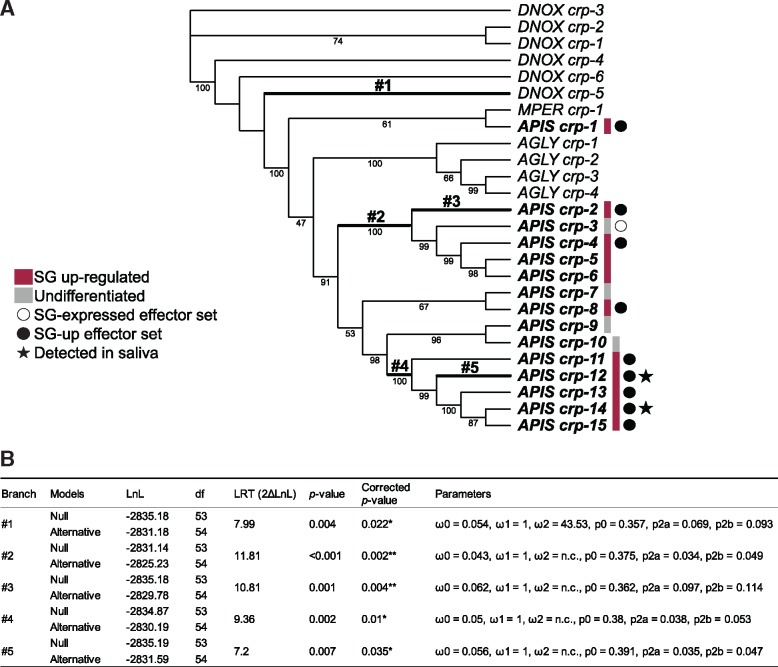
Fig. 4.
—Evolutionary analysis of the Aphididae CRP gene family. (A) Codon-based maximum-likelihood tree used to compute dN/dS under the branch-site (BS) model of codon substitution. Numbers below branches indicate bootstrap support (percentage of the 1,000 replicates) when >40. DNOX, MPER, AGLY, and APIS indicate sequences from Diuraphis noxia, Myzus persicae, Aphis glycines, and Acyrthosiphon pisum, respectively. Branches where positive selection affected certain sites are in bold. (B) Estimated evolutionary parameters for these branches (numbered as on the tree). ω0, ω1, and ω2 indicate the average dN/dS ratio for sites assigned to class 0 (ω < 1, negative selection), class 1 (ω = 1, neutral evolution) and class 2 (ω > 1, positive selection), respectively, in the branch, and n.c. indicates insufficient dS to compute ω. p0, p2a, and p2b show proportions of sites in classes 0, 2a, and 2b, respectively, for each branch (Yang and Nielsen 2002).

