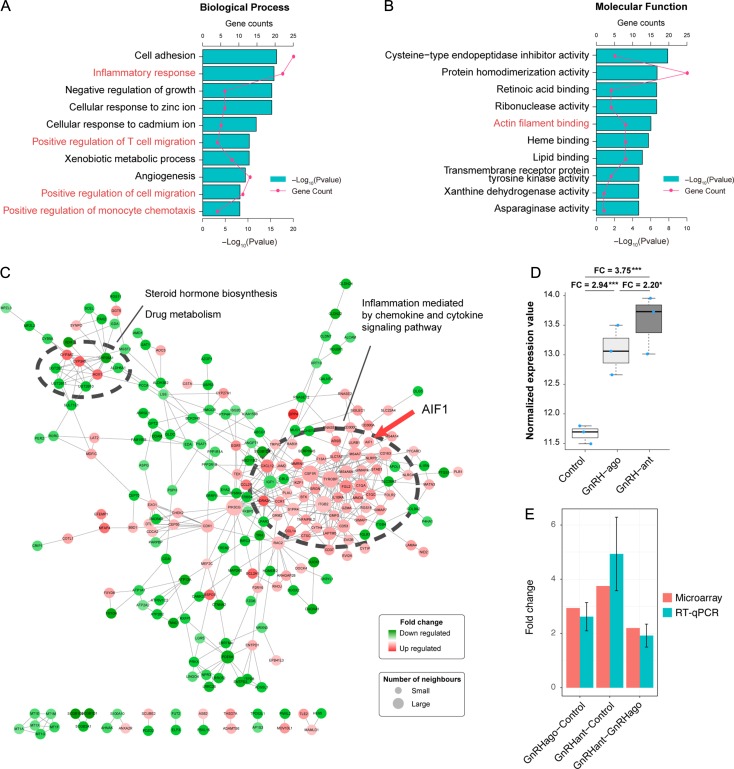
Figure 2.
AIF-1 microarray expression and validation (n = 3 per group). (A and B) Functional enrichment results of differentially expressed genes (DEGs), including Kyoto Encyclopedia of Genes and Genomes (KEGG) pathway and gene ontology (GO). P-values and gene count of each term are shown as bar plots and lines, respectively. Red text indicates that AIF-1 was among the genes identified. (C) Protein and protein interaction network. Red nodes indicate upregulated proteins, and green nodes indicate downregulated proteins. The size of the node was positively correlated with the quantity of related genes and the larger module was associated with immune activation and contained AIF-1 (red arrow). (D) AIF-1 mRNA expression between the control, GnRH agonist (GnRH ago) and GnRH antagonist (GnRH ant) groups using microarray. ‘FC’ refers to fold change. The y-axis is log 2 scaled and the upper whisker, upper side of box, thick line in the box, lower side of box and the lower whisker corresponds to maximum value, upper 75% quantile, median, lower 25% quantile and minimum value, respectively. (E) AIF-1 mRNA expression in the GnRH agonist/control, GnRH ant/control, and GnRH ant/GnRH agonist using microarray and RT-qPCR analyses. Error bars are expressed as SEM.

