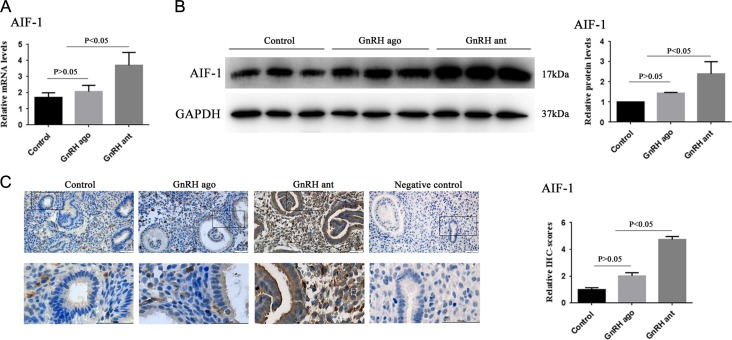
Figure 3.
AIF-1 expression levels in the control group, GnRH agonist group and GnRH antagonist group. (A) Graphs illustrate the relative mRNA level of AIF-1 among the three groups as assayed by RT-qPCR. Analyzed by ANOVA, followed by Bonferroni test. (B) Representative Western blotting images and quantification of AIF-1 protein in the three groups. (C) Representative images and quantification of AIF-1 in the three groups as assessed by immunohistochemistry. All data are presented as mean ± SEM. The differences between groups were analyzed by Kruskal–Wallis test, followed by multiple comparisons using Mann–Whitney U-test in panel B and C. Data were considered statistically significant if P < 0.05.

