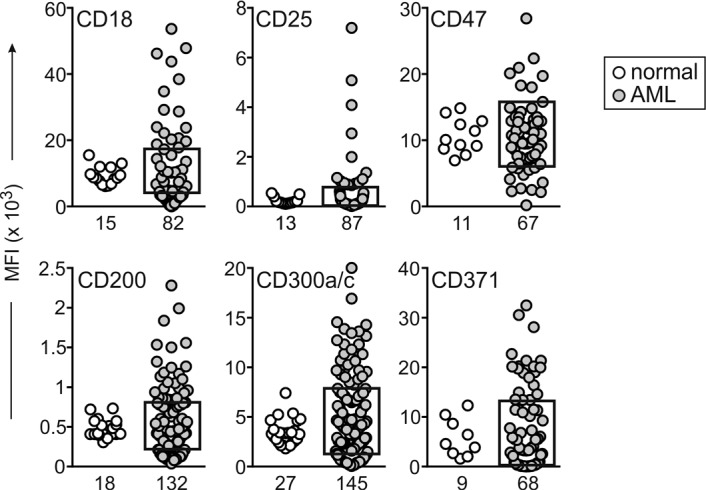
Figure 3. Genes whose expression in AML cells by flow cytometry was not statistically different than that of their normal counterparts.

Plots indicate median fluorescence intensity (MFI) of each marker in CD34+ myeloid cells from leukemia-free bone marrow aspirates (white circles) and in diagnostic AML samples (gray circles). The box on the AML plots indicates the upper and lower normal limits. The number of samples studied is indicated under each plot. By unpaired t test with Welch’s correction, P > 0.05 for all markers, except CD25 (P = 0.049) and CD300a/c (P = 0.020). Some AML samples show considerable overexpression or underexpression.
