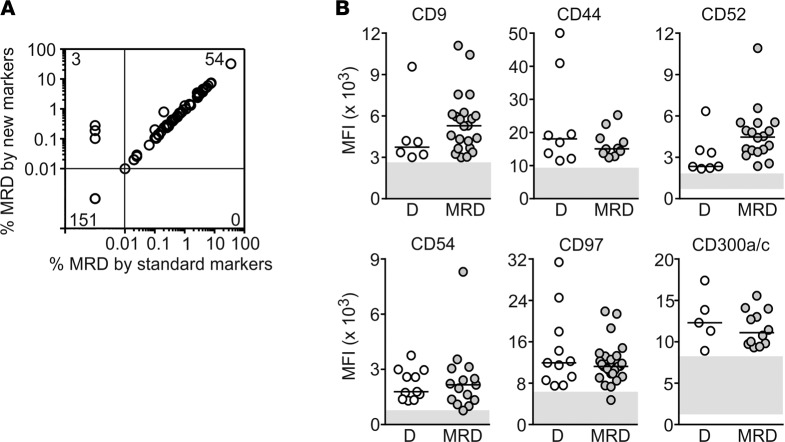
Figure 5. The selected markers allow detection of MRD and remain aberrantly expressed during chemotherapy.
(A) Relation between MRD levels measured using the markers identified in this study versus those measured with standard markers (see Supplemental Table 5). Spearman correlation of positive MRD results by both methods: r = 0.9816, P < 0.0001. (B) Median fluorescence intensity (MFI) of the indicated markers measured at diagnosis (D) and during chemotherapy (MRD). Horizontal bars correspond to the median value in each group. Gray areas include the MFI of normal CD34+ myeloid progenitors.

