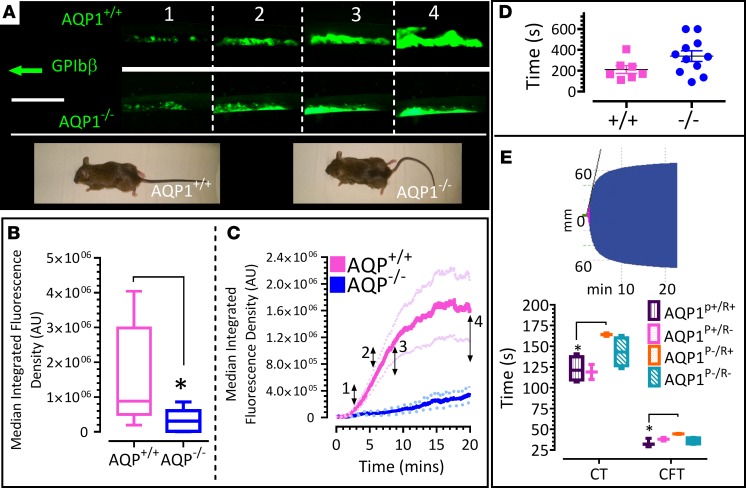
Figure 4. Constitutive (whole animal) ablation of AQP1 suppresses thrombus formation in vivo and in vitro without affecting hemostasis.
(A–C) Mice were administered DyLight 488–conjugated anti-GPIbβ antibody to label platelets. Carotid artery damage was achieved by treatment with FeCl3. Fluorescently labeled platelets were imaged by intravital microscopy. Images at frames indicated in A correspond to time points indicated in C. Wild-type (AQP1+/+) and AQP1-null (AQP1–/–) mice images show comparable growth rates and gross morphology. (B) Median fluorescence integrated density (MFID) is shown as interleaved box-and-whisker plots, with whiskers showing minimum to maximum values, medians, and interquartile ranges. (C) The time course of change in MFID (median and minimum and maximum values) for thrombus formation in AQP1+/+ and AQP1–/– mice. (D) Tail bleed times were assessed, and data shown are mean ± SEM of time to stop bleeding. (E) Ablation of AQP1 in platelets delayed clotting times in intrinsic pathway analyses of whole mouse blood coagulation. The inset shows thromboelastometry (ROTEM) data; the histogram shows clotting time (CT) and clot formation time (CFT) for freshly drawn, citrated whole AQP1+/+ and AQP1–/– mouse blood. Using a platelet-rich plasma (PRP) swap approach, blood is reconstituted as shown. AQP1P+/R+ indicates AQP1+/+ PRP combined with AQP1+/+ red and other cells (RBC); AQP1P+/R– indicates AQP1+/+ PRP combined with AQP1–/– RBC; AQP1P–/R+ indicates AQP1–/– PRP combined with AQP1+/+ RBC; and AQP1P–/R– indicates AQP1–/– PRP combined with AQP1–/– RBC. Data analysis was performed by Wilcoxon signed-rank test. Scale bar: 2 mm. *P < 0.05 was considered significant. Data were from 8 independent experiments.

