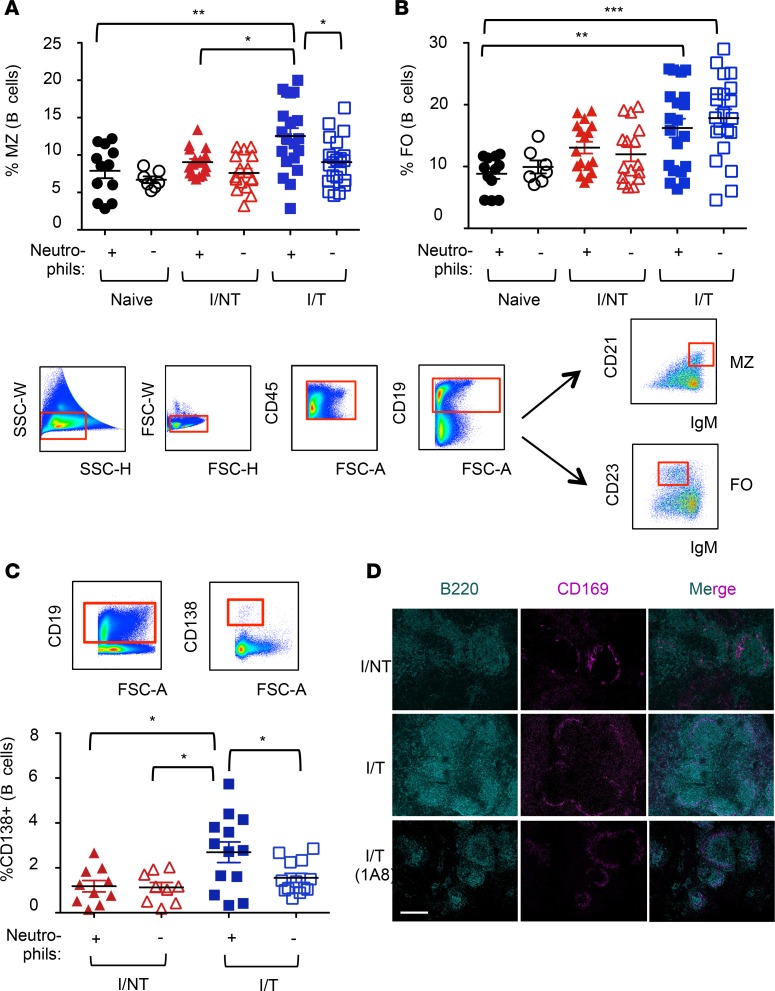
Figure 6. Effects of neutrophil depletion on B cell responses.
Neutrophils of naive, I/NT, and I/T mice were depleted, or not, as indicated in Figure 1A. (A and B) Frequency of MZ and follicular (FO) B cells. Spleen cells were isolated at day 14 p.i. and were analyzed by flow cytometry for the frequency of MZ (CD21hiIgMhi) (A) and FO (CD23+IgMlo) (B) CD19+ B cells, as depicted in the gating strategy. (C) Frequency of plasma cells. BM cells were isolated at day 14 p.i. and were analyzed by flow cytometry for the frequency of CD138+ (CD19+) B cells. The data represent 5 independent experiments, with 7–12 mice per group for naive mice and 17–21 per group for I/NT and I/T mice. Data are expressed as mean ± SEM. Statistical significance was established using a parametric 1-way ANOVA test with a Bonferroni correction (*P < 0.05; **P < 0.01; ***P < 0.001). (D) Histological analyses of spleen sections. Immunolabeling of B cells (B220+) and macrophages of the MZ (CD169+) was performed in sections from spleens of infected/nontreated and infected/treated mice (depleted or not of neutrophils) recovered at 14 days p.i. to visualize germinal centers. The images are representative of 4 separate mice for each experimental condition. Scale bar: 200 μm.

