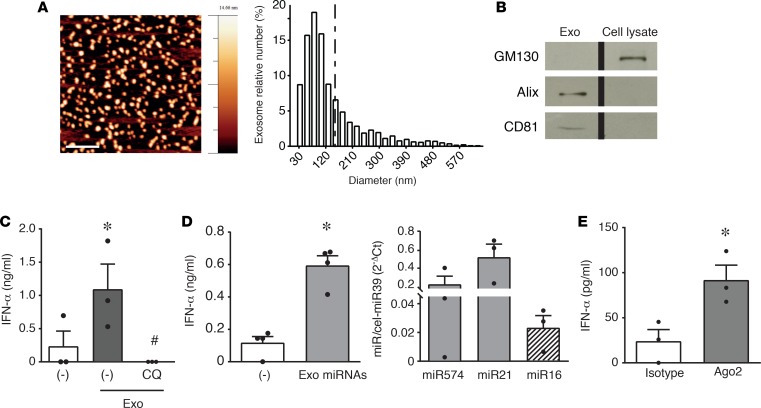
Figure 2. Exosomal microRNAs from HaCaT-conditioned media activate IFN-α secretion by pDCs.
(A) AFM topography image of HaCaT exosomes (scale bar: 500 nm) (left); size distribution obtained by image analysis of >1,400 round-shaped objects with a diameter ranging between 1 and 650 nm (5 μm × 5 μm fields, n = 3) demonstrating a prevailing exosome size (30–150 nm) (right). (B) Western blot of HaCaT exosomes showing the expression of exosome markers Alix and CD81 and the lack of cis-Golgi matrix protein GM130 (negative control). One experiment out of 2 is represented; the lanes were run on the same gel but were noncontiguous. (C) pDCs were stimulated with exosomes obtained from HaCaT-conditioned media. Where indicated, pDCs were pretreated with 1 μM CQ for 1 hour. Data are expressed as the mean ± SEM (n = 3); *P < 0.05 versus (–) or #P < 0.05 versus “(–)Exo” by paired Student’s t test. (D, left) MicroRNAs from HaCaT exosomes were purified and used to stimulate pDCs. Data are expressed as the mean ± SEM (n = 4); *P < 0.05 versus (–) by paired Student’s t test. (D, right) Expression of selected microRNAs in exosomes obtained from HaCaT-conditioned media was evaluated by real-time PCR. Results were normalized over spiked-in cel-miR39. Data are expressed as the mean ± SEM (n = 3). (E) Native, Ago2-bound microRNAs were immunoprecipitated with anti-Ago2 or isotype control mAb, purified with a commercial microRNA enrichment kit, and used to stimulate pDCs. Data are expressed as the mean ± SEM (n = 3); *P < 0.05 versus (isotype) by paired Student’s t test. In all the experiments, the secretion of IFN-α was evaluated by ELISA after a 24-hour stimulation.

