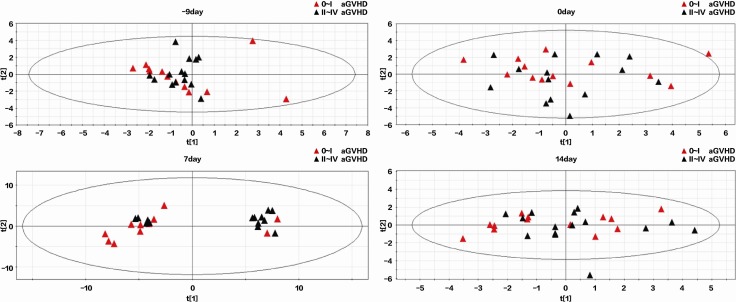
Figure 2. Principal component analysis score plots of GC-MS metabolic profiles in 0–I and II–IV aGVHD patients in the discovery data set on days –9, 0, 7, and 14 after transplantation.
The plots separating samples from 0–I (red triangles, n = 13) and II–IV (blue triangles, n = 15) aGVHD patients based on GC-MS metabolic profiling 9 days prior to transplantation (top left), on the day of transplantation (top right), and 7 (bottom left) and 14 (bottom right) days after transplantation. Compared with the other time points, an obvious separation trend was observed between the red and blue triangles in the scores plot on day 7 although slight overlapping was seen.

