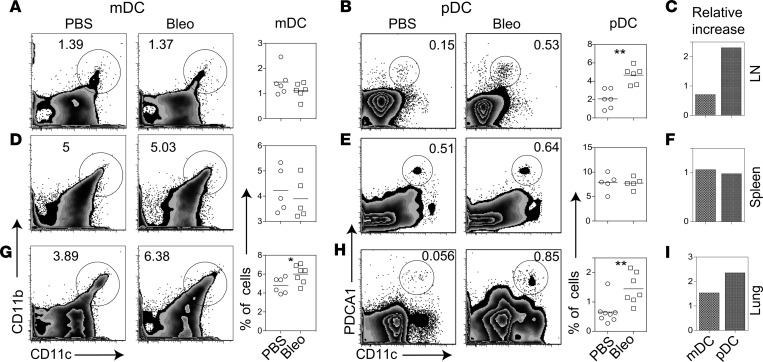
Figure 1. Effect of s.c. bleomycin on DCs in the lung-draining lymph nodes, spleen, and lung.
(A, B, D, E, G, and H)Animals were injected s.c. with bleomycin (Bleo) or PBS daily for 2 weeks. Twenty-eight days after the first injection, mediastinal lymph nodes (LN), spleen, and lungs were harvested. Their single cell suspension were analyzed for pDCs and mDCs. Numbers on FACS plots represent the percentage of gated cells: CD11cintPDCA-1+ cells as % of live SSclowFSClow cells (lymphocyte gate) for pDCs, and CD11b+CD11c+ cells as % of all live cells (autofluorescent cells excluded) for mDCs. Results are expressed as representative FACS plots and as symbol plots, where each symbol represents a single animal. Horizontal lines denote mean. C, F, and I show a relative increase (ratio) in mDCs and pDCs in bleomycin-injected mice as compared with PBS-injected mice. Results shown are representative of 3 independent experiments. *P < 0.05; **P < 0.01, Mann-Whitney U test.

