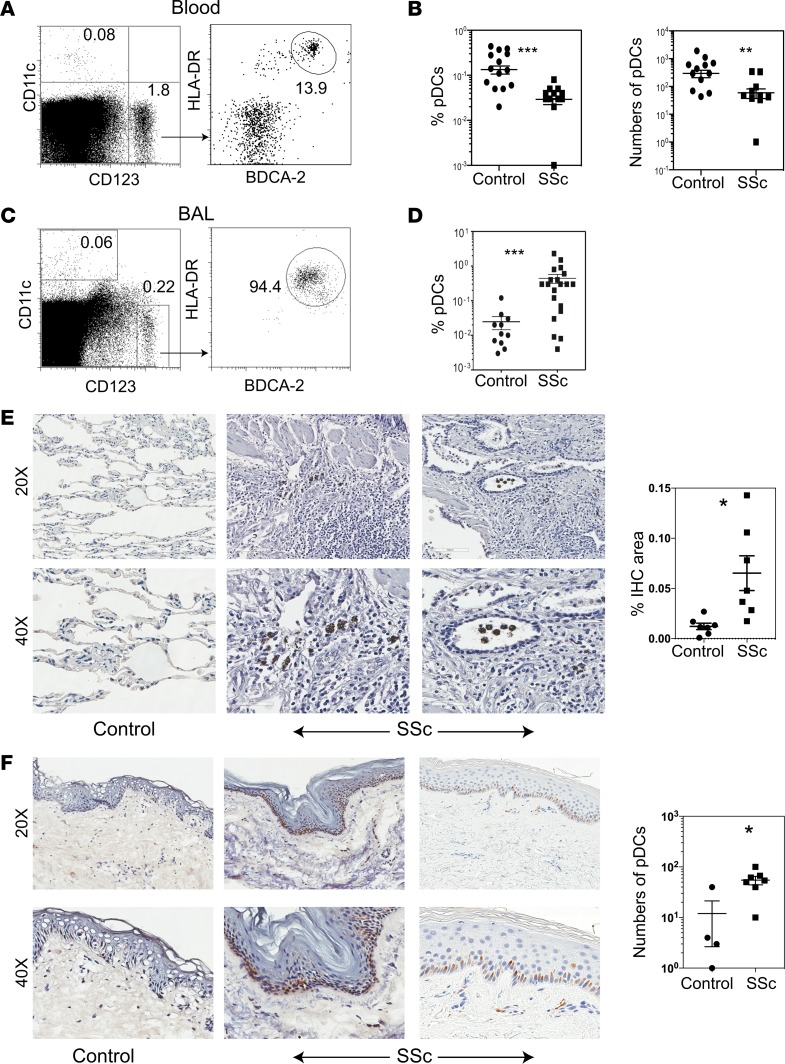
Figure 8. Detection of pDCs in the peripheral blood, BAL, and lung and skin tissues from patients with SSc and controls.
(A and B) Peripheral blood mononuclear cells from 15 each of healthy controls and patients with SSc were analyzed by flow cytometry for CD11c, CD123, HLA-DR, and BDCA-2 expression. Representative dot plots show CD11c–CD123+ cells that were further analyzed for HLA-DR+BDCA-2+ cells, which are expressed as % of gated CD11c–CD123+ cells on dot plots (A). The percentage (expressed as the % of CD123+CD11c–HLA-DR+BDCA-2+ cells of total blood cells) and total number of peripheral blood pDCs were compared between healthy controls and SSc patients (B). Data are shown as individual sample values and as the mean ± SEM. **P < 0.01 and ***P < 0.001 (unpaired 2-tailed t test). (C and D) BAL cells from SSc-ILD patients before enrollment into the imatinib trial were analyzed by flow cytometry for CD11c, CD123, HLA-DR, and BDCA-2. Representative dot plots from SSc patients show CD11c–CD123+ cells that were further analyzed for HLA-DR+BDCA-2+ cells (C). BAL samples from patients who had bronchoscopy for respiratory symptoms but not found to have any significant lung disease on further evaluations were used as controls. The percentage of BAL pDCs were compared between SSc-ILD patients and controls (D). pDCs are expressed as the % of CD123+CD11c–HLA-DR+BDCA-2+ cells of total BAL cells (mean ± SEM; ***P < 0.001, unpaired t-test). (E) Paraffin-embedded sections (4 μm) of lung tissues were obtained from SSc-lung explants and control lungs (wedge resection for spontaneous pneumothorax or traumatic lung laceration or lungs collected at autopsy from cases with renal cancer or liver cirrhosis). The sections were stained with anti–BDCA-2 Ab to detect pDCs. While the control lungs had no to a few BDCA-2+ cells (left panels), all SSc lungs show BDCA-2+ cells in the interstitial tissue (middle and right panels) and bronchi (right panels). Stained sections were digitized using the Aperio scanning system. Results from individual subjects are expressed in a symbol plot as the percent IHC-stained area (mean ± SEM; *P = 0.01, unpaired 2-tailed t test). (F) Frozen sections (6 μm) of 6-mm punch skin biopsies from patients with 4 SSc and 2 healthy volunteers were stained for BDCA-2. Similar results were obtained in a separate experiment using paraffin-embedded skin sections from 4 each of SSc patients and healthy volunteers. Representative photomicrographs show no to rare BDCA-2+ cells in control skin (left panels), but abundant BDCA-2+ cells in the epidermis and dermis of 2 SSc patients: a 41-year-old man with an mRSS of 33 (middle panels) and a 21-year-old woman with an mRSS of 25 (right panels). The stained cells were manually counted, and the results from individual subjects are shown in a symbol plot as the number of pDCs per mm3 (mean ± SEM; *P = 0.01, unpaired 2-tailed t test).

