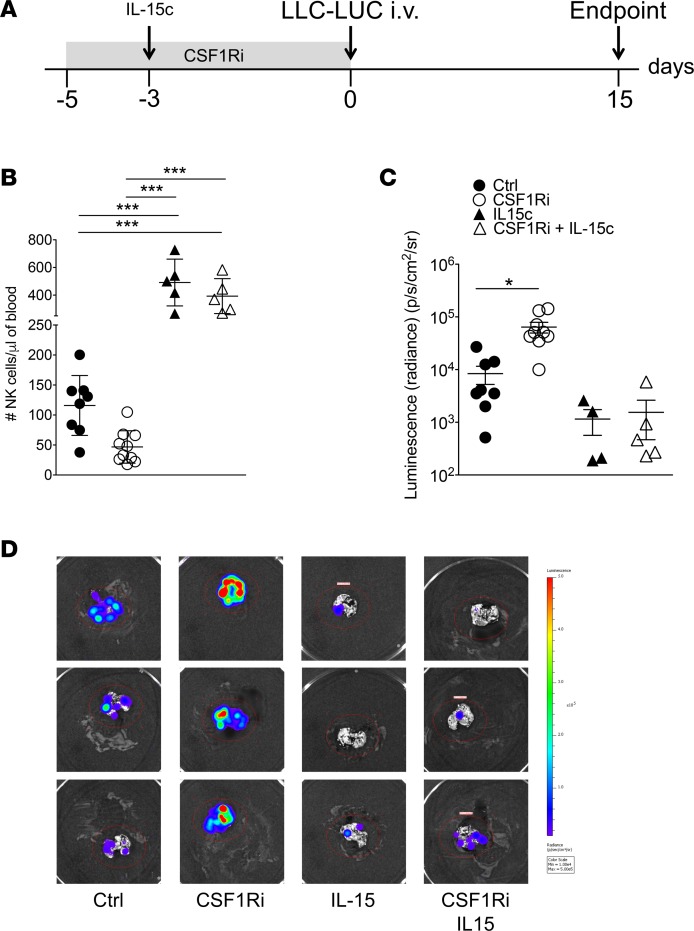
Figure 4. Exogenous IL-15 prevents CSF1Ri-induced loss of NK cells and metastasis.
(A) Experimental timeline. (B) Number of circulating NK cells defined as CD45.2+CD3–NK1.1+NKp46+ live singlets on day 3. Each symbol represents an individual mouse. Ctrl, n = 9; CSF1Ri, n = 10; IL-15c, n = 5; CSF1Ri + IL-15c, n = 5. Mean ± SD. ***P < 0.005 (1-way ANOVA with Bonferroni’s correction). A representative experiment of 2 is shown. (C) Quantification of tumor burden in the lungs by bioluminescence. Each symbol represents an individual mouse. Ctrl, n = 9; CSF1Ri, n = 10; IL-15c, n = 5; CSF1Ri + IL-15c, n = 5. Mean ± SEM. *P < 0.05 (1-way ANOVA with Bonferroni’s correction). A representative experiment of 2 is shown. (D) Representative bioluminescence images of resected lungs at the endpoint.

