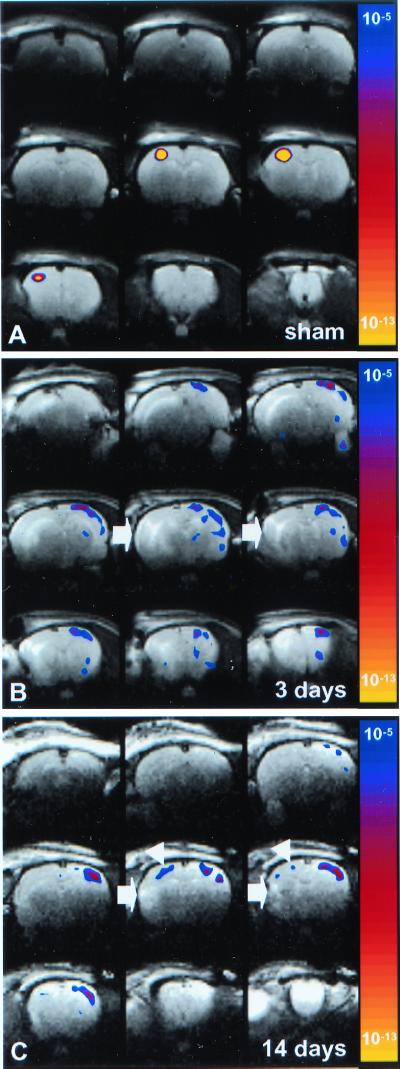
Figure 3.
T2-weighted images of coronal rat brain slices overlaid by statistical activation maps, calculated from the cross-correlation between the left (impaired) forelimb stimulation paradigm and local cerebral rCBV changes. The map of P values has been color-coded corresponding to the degree of significance. (A) 14 days after sham-operation (Rat 5); (B) 3 days after stroke (Rat 4); (C) 14 days after stroke (Rat 1). Left forelimb stimulation induced significant activation responses in the contralateral (right) M1/S1fl in sham-operated rats. At 3 days after stroke, no significant activation was detected in the right, ipsilesional M1/S1fl. However, clear responses were found in the contralesional hemisphere, extending over the entire neocortex. After 14 days, activation responses appeared both contralesional and ipsilesional; however, shifted from M1/S1fl (white arrowheads). The area of infarction is characterized by increased T2-weighted signal intensity (white arrows).

