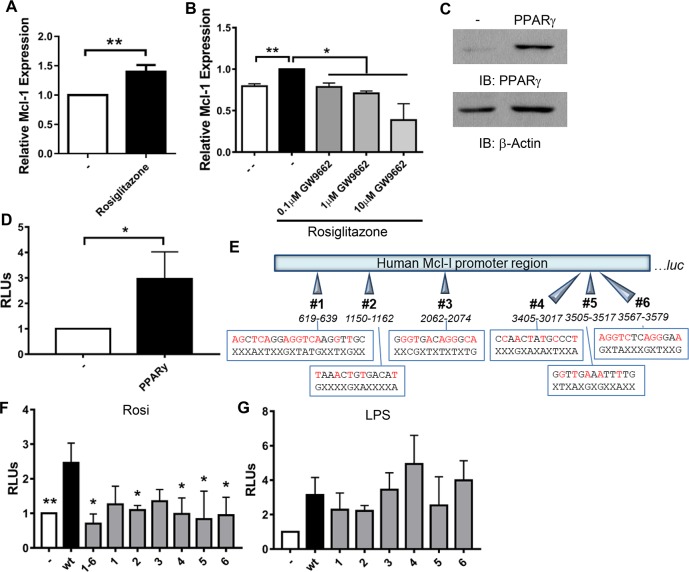
Fig 2. PPARγ induces Mcl-1 expression.
A and B) MDMs were treated with 100 nM rosiglitazone without (A) or with (B) 1h pre-treatment with GW9662. After 24 h, total RNA was collected and Mcl-1 gene expression analyzed by qRT-PCR. Results are the mean ± SEM of N = 5 (A) or 2 (B). C, D, F) RAW cells were transfected with wild-type (wt; C, D, F) and mutated (F) Mcl-1 promoter luciferase reporter constructs, with and without PPARγ expression plasmids. C) Western blot was performed to confirm PPARγ expression. D and F) After transfection, cells were stimulated with 100 nM rosiglitazone. After 24 h, luciferase activity was determined and normalized to total protein. Results are expressed as (RLUs) normalized to cells not expressing PPARγ and are the mean ± SEM of N = 14 (D) or 2–4 (F), * indicate a significant difference between wt reporter and the indicated condition. E) Schematic of Mcl-1 promoter region upstream of the luciferase gene (luc) in pGL3. The six putative PPREs are indicated, wt sequences are shown on the top with red indicating consensus to PPRE (AGGTCAnAGGTCA), with mutated sequences below and X indicating no change. G) RAW cells were transfected with wt or mutated Mcl-1 promoter luciferase reporter constructs. After transfection, cells were stimulated with 1 μg/ml LPS. After 24 h, luciferase activity was determined and normalized to total protein. Results are expressed as relative luminescence units (RLUs) normalized to cells not stimulated with LPS and are the mean ± SEM of N = 2–3. A-F) * p < 0.05, ** p < 0.01.

