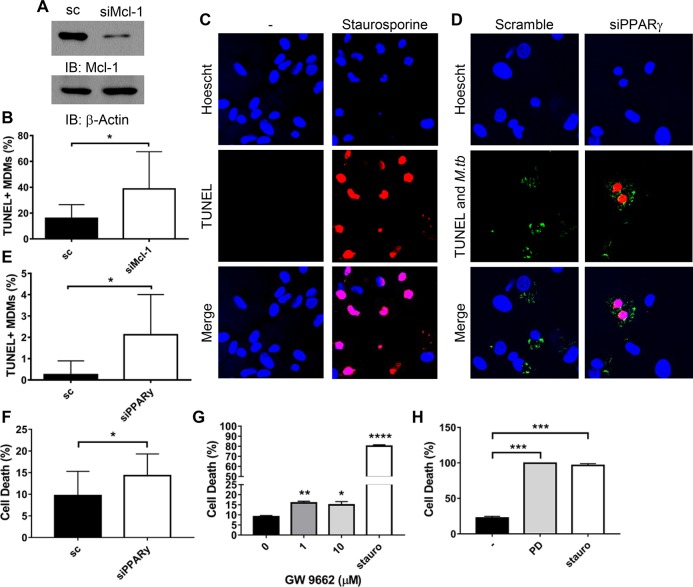
Fig 5. PPARγ and Mcl-1 limit apoptosis during M.tb infection.
A, B, D, E) MDMs were transfected with Mcl-1 (A and B), PPARγ (D and E), or scrambled control (sc) siRNA then infected with fluorescent M.tb at MOI 50 for 24 h (B), or MOI 5 for 48 h (D and E). Due to the variability amongst donors, these different conditions were necessary to see low levels of apoptosis in the scrambled control cells, mean 8.66 ± 3.69% (B) and 2.30 ± 1.69% (E). A) Western blot showing Mcl-1 knockdown efficiency, mean knockdown efficiency was 76.6 ± 5.47% (N = 5). B and E) Data are representative of 3 experiments and are expressed as percentage of TUNEL+ MDMs and are the mean ± SD. The cumulative increase in TUNEL+ MDMs following knockdown (N = 3) is shown in S4A and S4B Fig. C) MDMs were treated with 5 μM staurosporine overnight then fixed and TUNEL staining performed. C and D) Representative images of TUNEL staining, with TUNEL staining indicated in red and fluorescent M.tb in green. F, G, H) MDMs were transfected with PPARγ or scrambled control (sc) siRNA (F) or pre-treated with GW9662 (G) or PD146176 (H) for 1 h, then infected with M.tb at MOI 5 for 24 h. MDMs were also treated with 5 μM staurosporine for 24 h. Cell death was determined with the CellTiter Glo Assay, data are expressed as % cell death, with uninfected cells set to 0%. Results are mean ± SEM of N = 3 (F) or 2 (H), or representative of n = 5 (G). A-H) * p < 0.05, ** p < 0.01, *** p < 0.001, **** p < 0.0001.

