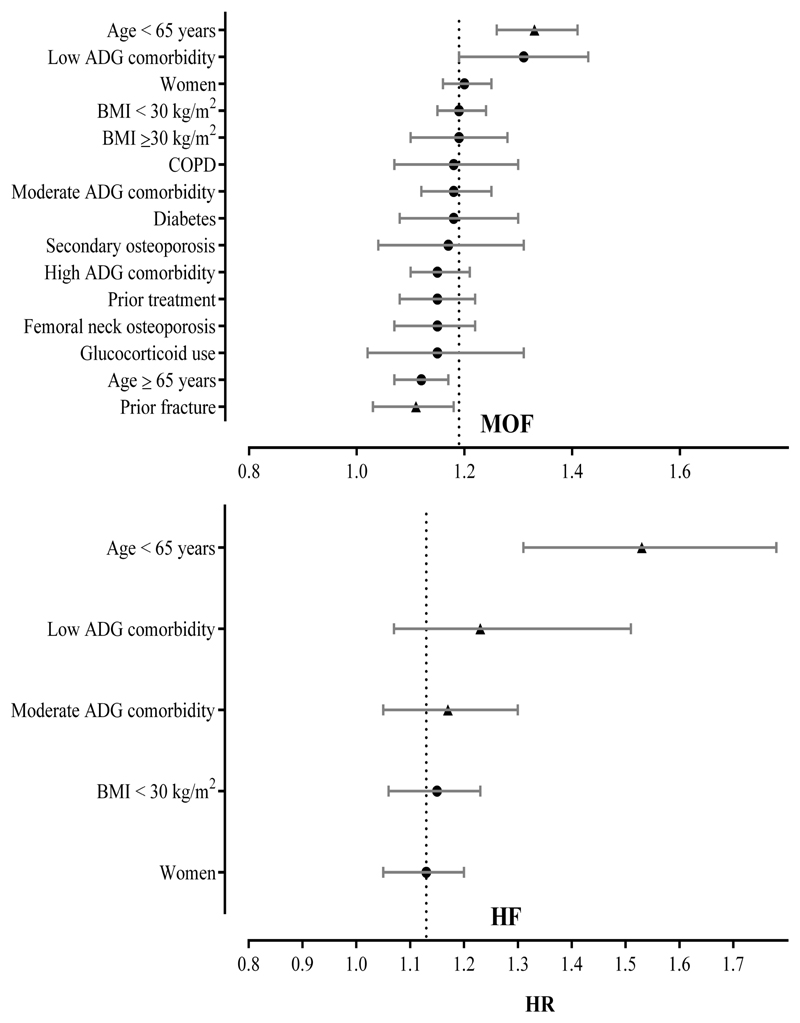
Figure 2.
Rank-ordered HRs with 95% CI bars for each SD reduction in TBS to predict MOF (panel above) and HF (panel below) stratified by clinical variables. Only statistically significant HRs are included. The dashed line indicates the HR for all cases. Variables with statistically significant interactions are denoted by a triangle.

