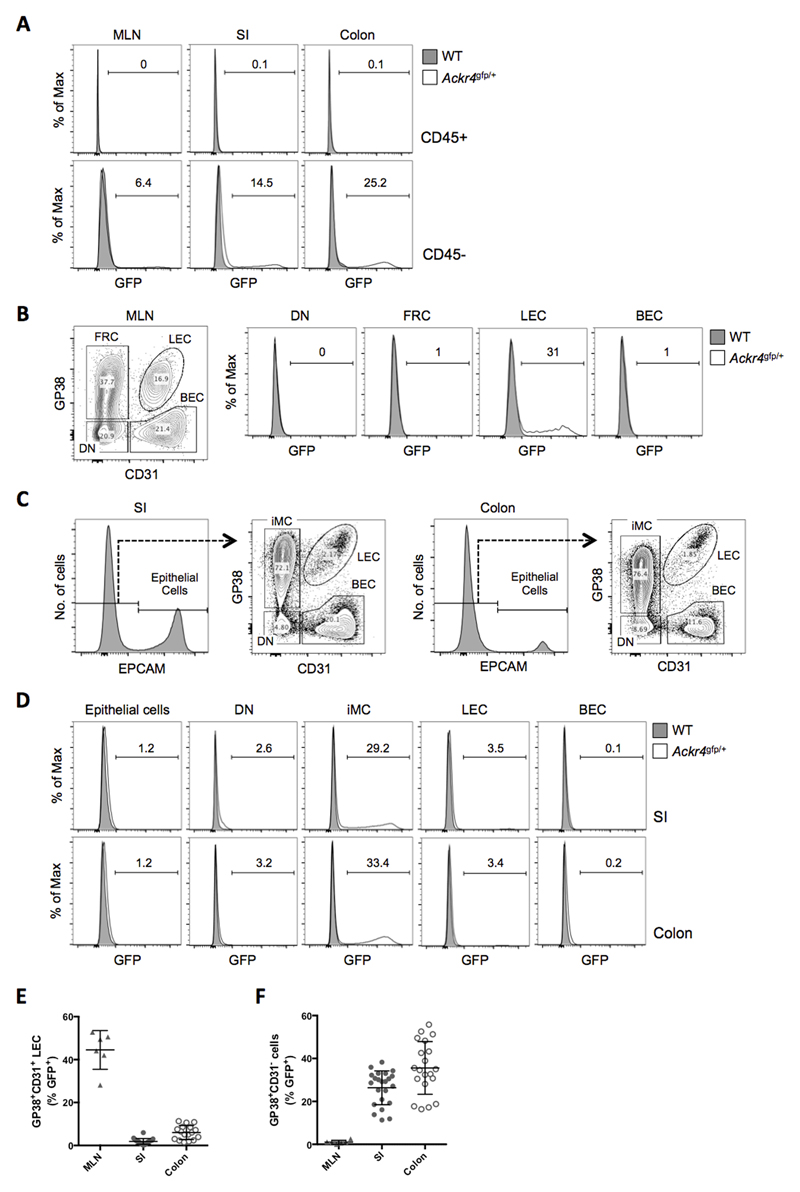
Figure 1. Ackr4 is expressed by LECs in the MLN and mesenchymal cells in the intestine.
(A) Overlaid histogram flow cytometry plots showing GFP expression by CD45+ (top panels) and CD45- cells (bottom panels) among single, live, Ter119- cells in cell suspensions of the MLN, small intestine (SI) and colon of WT and Ackr4gfp/+ (Ackr4tm1Ccbl) mice. (B) Left panel: flow cytometry contour plot of stromal cell populations among single, live, CD45-Ter119- cells in the MLN, identifying GP38+CD31- fibroblastic reticular cells (FRC), GP38+CD31+ lymphatic endothelial cells (LEC), GP38-CD31+ blood endothelial cells (BEC) and GP38-CD31- ‘double negative’ (DN) cells. Right panels: representative overlaid histogram plots showing GFP expression by stromal cell populations in the MLN of WT and Ackr4gfp/+ mice. (C) Flow cytometric analysis of stromal cell populations among single, live, CD45-Ter119- cells in the SI and colon, identifying EpCAM+ epithelial cells (histograms), and GP38+CD31- intestinal mesenchymal cells (iMC), LECs, BECs and DN cells in the EpCAM- population (contour plots). (D) Representative overlaid histograms showing GFP expression by stromal cell populations in the SI and colon of WT and Ackr4gfp/+ mice. In A, B and D, the numbers on the histogram plots indicate the percentage of GFP+ cells in Ackr4gfp/+ samples. Flow cytometry plots in A-D are representative of those from at least three individual experiments involving at least three mice of each genotype. (E, F) Percentage of cells expressing GFP in LEC (E) and GP38+CD31- cell (F) populations in the MLN (n=6), SI (n=23) and colon (n=20) of Ackr4gfp/+ mice. Mean±1SD is indicated. Data are pooled from two or more individual experiments.

