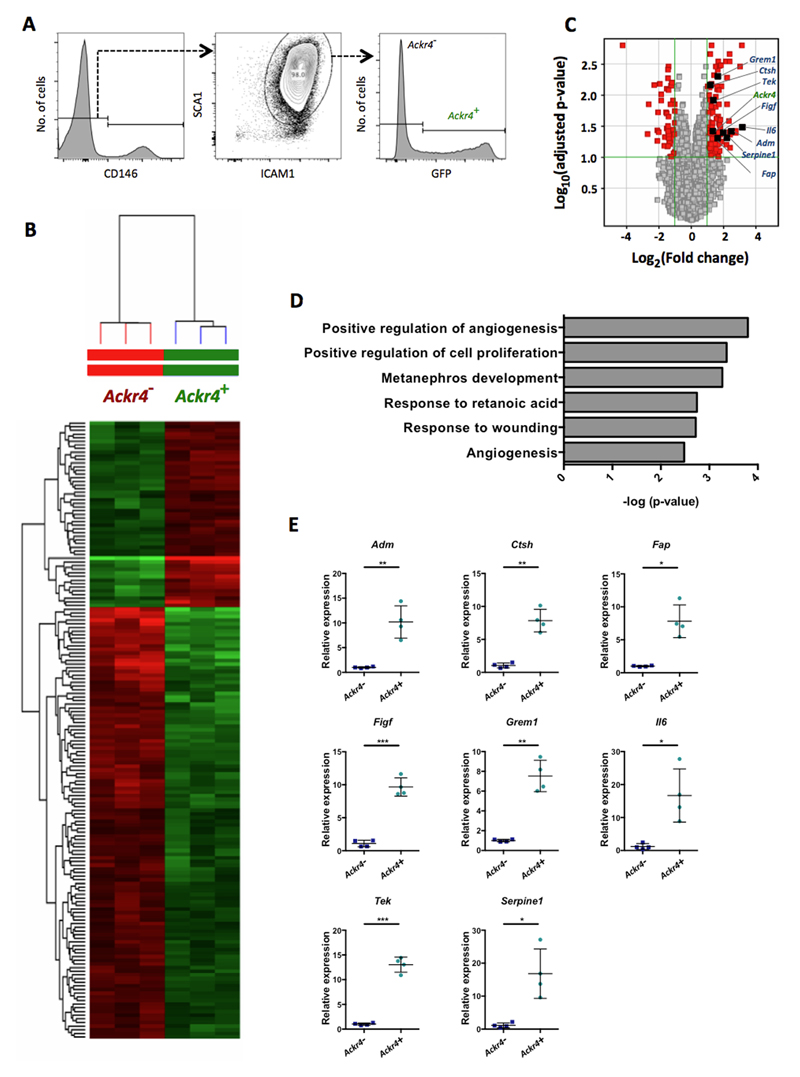
Figure 6. Ackr4+ fibroblasts show elevated expression of multiple endothelial cell regulators.
(A) FACS gating strategy used to isolate Ackr4+ and Ackr4- cells from among live single CD45-GP38+CD31- cells from the small intestine of Ackr4gfp/+ (Ackr4tm1Ccbl) mice. (B) Heatmap showing the relative signal intensities of the 165 transcripts that were differentially expressed between the Ackr4+ and Ackr4- cells (Fold Change ≥2; adjusted p value <0.05; FDR 0.1). (C) Volcano plot showing differences between Ackr4+ and Ackr4- cells in their expression of all genes analyzed, against the statistical significance of those expression differences. Genes shown in red have a Fold Change ≥2 and an adjusted p value of <0.1: those on the right hand side are more highly expressed in Ackr4+ cells; those on the left are more highly expressed in Ackr4- cells. Ackr4 and genes analyzed in panel E are highlighted. Significance was calculated using a modified t-test, and adjusted using a Benjamini Hochberg multiple testing correction. (D) The biological processes most significantly upregulated in Ackr4+ cells compared to Ackr4- cells, as determined using DAVID Bioinformatics Resources. (E) Relative expression of eight genes in Ackr4+ and Ackr4- cells, as determined by QPCR analysis of cDNA from cells FACS-sorted from among live single CD45-GP38+CD31- cells from the small intestine. Gene names are indicated at the top of each graph. Data points from individual mice are shown, along with means (±1SD). Mean expression in Ackr4- cells is set to 1. *p< 0.05, **p < 0.01, ***p< 0.001; Student’s t test.

