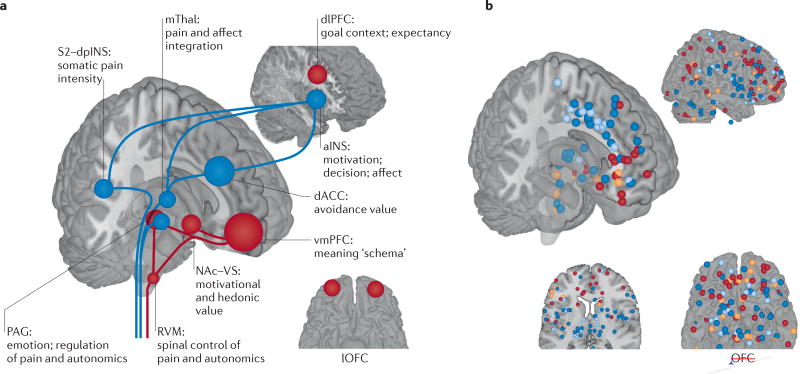
Figure 3. The neurophysiology of placebo analgesia.
a | An overview of the brain regions involved in the placebo effects on pain and their potential functions in this context. The areas shown in blue respond to painful stimuli and, on that basis, are expected to show reduced responses to pain after placebo treatment. These areas include the medial thalamus (mThal), anterior insula (aINS), dorsal anterior cingulate cortex (dACC), periaqueductal grey (PAG) and secondary somatosensory cortex–dorsal posterior insula (S2–dpINS). Areas shown in red are associated with increases in response to placebo treatment (either before or during painful stimulation), and activity in these regions is thought to be involved with the maintenance of context information and the generation of placebo-related expectations and appraisals. They include the ventromedial prefrontal cortex (vmPFC), dorsolateral PFC (dlPFC), lateral orbitofrontal cortex (lOFC), nucleus accumbens–ventral striatum (NAc–VS), PAG and rostroventral medulla (RVM). Some regions, including the PAG and dACC, show different effects depending on the study and timing relative to painful stimulation. b | Results from neuroimaging studies of placebo-induced analgesia. Each point represents a finding from an individual study, reported in standard Montreal Neurological Institute space (all studies are listed in Supplementary information S2 (box)). Red points show increases in activity under placebo versus control treatment (that is, the same cream without the belief that it is a painkiller), and blue points identify decreases in activity under placebo. These comparisons involved randomized assignment to placebo or control conditions, and so they can test the causal effects of placebo treatment on brain activity. Some studies also examined correlations between the magnitude of placebo analgesia and the magnitude of placebo-induced changes in brain responses. Orange points identify positive correlations between the magnitude of an individual’s activity increases under placebo versus control treatment and the magnitude of placebo analgesia. Light blue points identify negative correlations. These correlations do not necessarily reflect causal effects of placebo on brain activity but can provide important information on the nature of the individual differences that predispose a person towards showing a larger versus a smaller placebo response.

