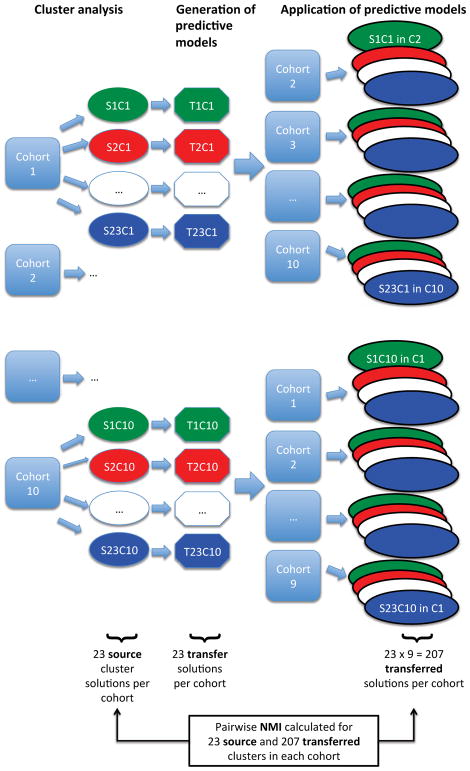
Figure 1.
Overview of Cluster Generation, Transfer, and Concordance Assessment. For each cohort, 23 “source” clustering solutions (S1 to S23) are generated (total of 230 solutions across the 10 cohorts). Each solution is transferred to the other cohorts via a predictive model (T1 to T23). Each solution is also labeled according to its parent cohort, thus source solution 1 from cohort 1 = S1C1. Each cohort ultimately produces 230 cluster solutions (23 source solutions, and 207 transferred solutions which are “predicted into” each cohort). The green, red, and dark blue colors correspond to cluster results generated by a specific cluster method and set of parameters (for example, “k-medoids with k=2”).

