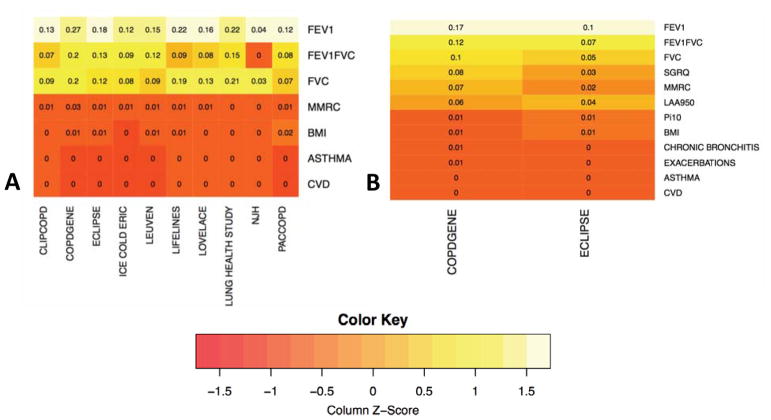
Figure 3.
Heatmap of Relative Feature Importance for Clustering by Cohort. Colors represent importance values generated by unsupervised random forests clustering. Higher values indicate that a given feature had a larger impact on the clustering results than other features in that dataset. Results for primary analysis in all ten cohorts are shown in Panel A. Results for the COPDGene and ECLIPSE substudy with more clustering features are shown in Panel B.

