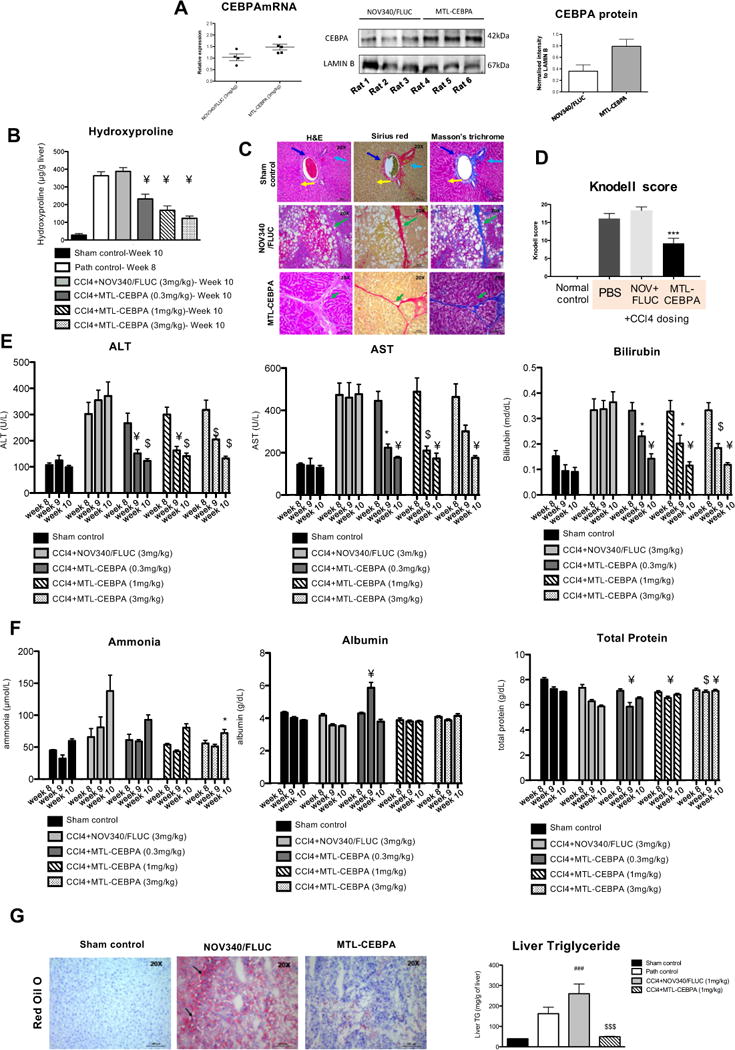
Figure 3. The effect of MTL-CEBPA treatment in CCl4 induced liver damage.

(A) MTL-CEBPA administration in rats caused an increase in liver CEBPAmRNA expression and protein. Total RNA and protein were extracted from the liver of treated animals. Protein levels were assessed using Image J to perform band densitometry measurements. (B) MTL-CEBPA caused a dose dependent decrease in hydroxyproline at week 10 when compared to NOV340/Fluc control. Normal hydroxyproline levels were observed in the sham control group at week 10 compared to the pathological (‘Path control’) group at week 8. Data is expressed as mean ± SEM vs. NOV340/FLUC. ¥ =p(<0.0002). (C) Liver sections at week 11 (‘Path control’) and week 13 (‘Sham control’) were stained with H&E, Sirius red and Masson’s trichrome. (Magnification – 20 X, Sham control, NOV304/FLUC and MTL-CEBPA treatment groups). Sham control animals revealed normal architecture with hepatocytes arranged in the form of cords (light blue arrow) radiating away from the central vein (dark blue arrow). Normal distribution of sinusoidal spaces (yellow arrow) was observed. In the NOV340/FLUC treatment groups fibrous bands (green arrow) extended from one portal area to the adjacent or to the central vein. In the MTL-CEBPA treatment group, thinner fibrous bands (green arrow) were observed, when compared to NOV340/FLUC group. (D) The severity of hepatic necrosis was assessed. MTL-CEBPA treatment caused a significant reduction in Knodell score (activity index). ***p<0.001 compared to Nov340/FLUC. Statistical Analysis, one-way ANOVA followed by Tukey’s multiple comparison test. The effect of MTL-CEBPA on liver function tests were assessed. (E) ALT, AST and bilirubin were measured and showed improvement at all doses of MTL-CEBPA. (F) Ammonia levels reversed despite continued exposure to CCl4. Although minor changes in levels of albumin and total protein (globulin) were observed; this appeared to be stabilized over the course of treatment. Data is expressed as mean ±SEM vs. NOV340/FLUC. *= p(0.0033); ¥=p(<0.00027); S=p(0.0006). The effect of MTL-CEBPA on fat deposit in the liver. (G) Cryosections of the liver were processed for Oil red O staining. Sham control animals showed absence of positively stained Oil red O positive fat globules. In the NOV340/FLUC group, there was an abundant number of Oil red O positive fat globules. This decreased in the MTL-CEBPA treated groups. Liver triglyceride levels were measured at week 13 to show a significant reduction in the MTL-CEBPA treated group. ###p<0.01 and $$$p<0.001 compared to NOV340/siFLUC. One-way ANOVA followed by Tukey’s multiple comparisons test.
