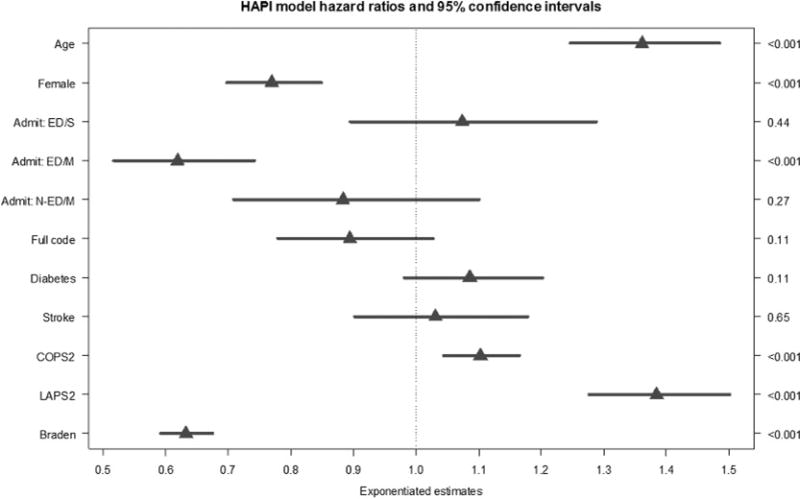
FIGURE 2.

Hazard ratio graph with 95% confidence intervals based on the multivariate Cox proportional hazards model (Table 4). The admission category of non-ED/surgical (N-ED/S) is the reference group and is not displayed. Admit ED/S = admission from the emergency department and a surgery during the episode; Admit ED/M = admission from the emergency room for a medical reason and did not have surgery during the episode; Admit N-ED/M = admitted directly to the hospital (not through the emergency department) for a medical reason; Full code = designation as a full code for the episode; LAPS2 = the Laboratory-based Acute Physiology Score, Version 2 (This is a score measuring acute physiologic instability during the 72 hours preceding admission—the higher the score, the greater the mortality risk due to acute physiologic derangement.); COPS2 = Comorbidity Point Score, Version 2 (This is a longitudinal score based on 12 months of patient data—the higher the score, the greater the mortality risk due to comorbid illness.); Braden = the lowest Braden score in the first 24 hours since admission (lower Braden scores indicate a greater risk for pressure injury development).
