FIG 2.

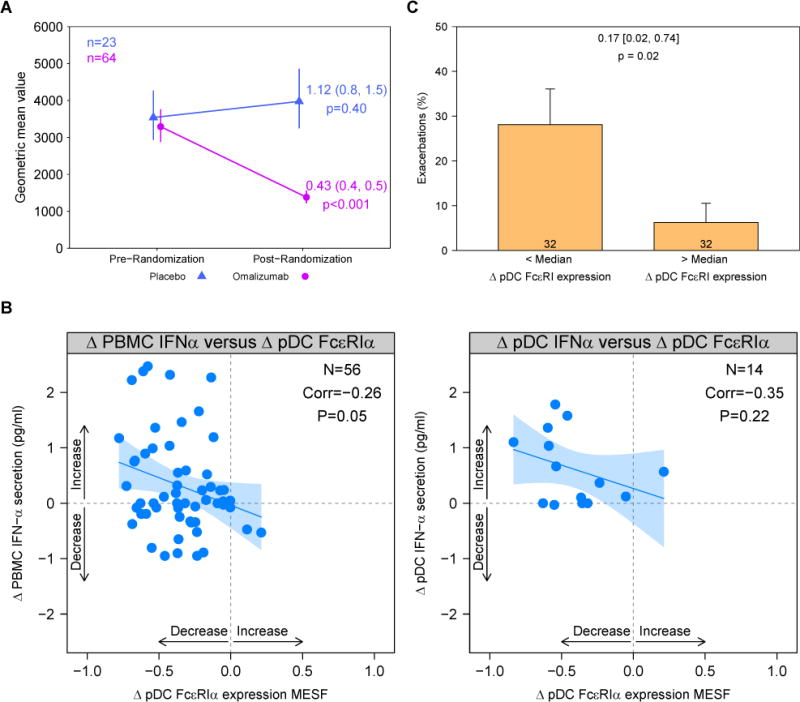
Loss of pDC FcεRIα surface expression is associated with restoration of IFN-α responses and decreased exacerbations. A, pDC surface FcεRIα expression is expressed as mean equivalent soluble fluorochrome values in the omalizumab group (represented in pink) and placebo group (represented in blue). Points represent geometric mean values at corresponding time points; vertical segments cover the 95% CI around the geometric mean. B, Correlation between change in IFN-α level and change in pDC FcεRIα surface expression in the omalizumab group. IFN-α levels were measured in PBMC (left) or pDC (right) supernatants after stimulation with anti-IgE plus rhinovirus; pDC FcεRIα expression was measured in unstimulated cells. Change is calculated as a log difference. Blue line and shading represent a linear model fit and its 95% CI. C, Proportion of exacerbations in the omalizumab group is associated with FcεRIα change. Bars represent the proportion of exacerbations during the study for each group (less than and greater than the median level of change in FcεRIα), and error bars represent SEs. Numbers annotated on the bars represent the number of subjects. Odds ratios, associated 95% CIs, and P values are annotated above the bars.
