
Fig. 3.
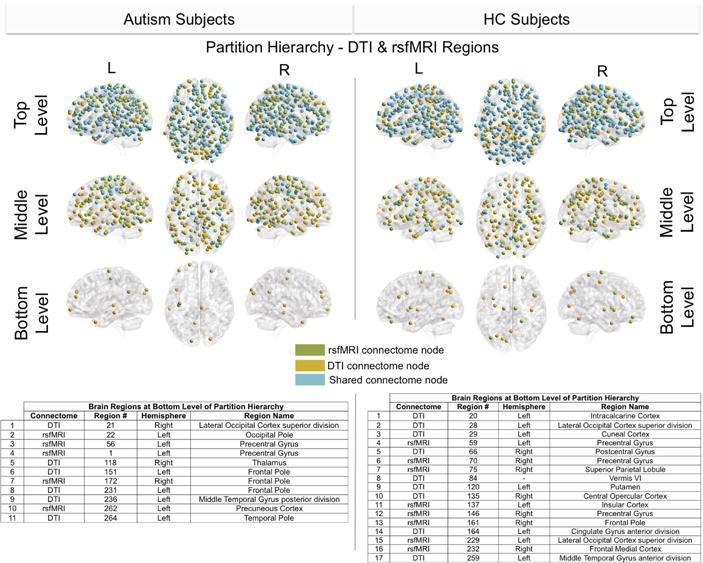
Visualizations that show the DTI and rsfMRI regions in the top, middle, and bottom partitions (see Fig. 1 for design of partition hierarchy). The tables summarize the brain regions in the bottom partition of the hierarchy.
Official websites use .gov
A
.gov website belongs to an official
government organization in the United States.
Secure .gov websites use HTTPS
A lock (
) or https:// means you've safely
connected to the .gov website. Share sensitive
information only on official, secure websites.
Visualizations that show the DTI and rsfMRI regions in the top, middle, and bottom partitions (see Fig. 1 for design of partition hierarchy). The tables summarize the brain regions in the bottom partition of the hierarchy.