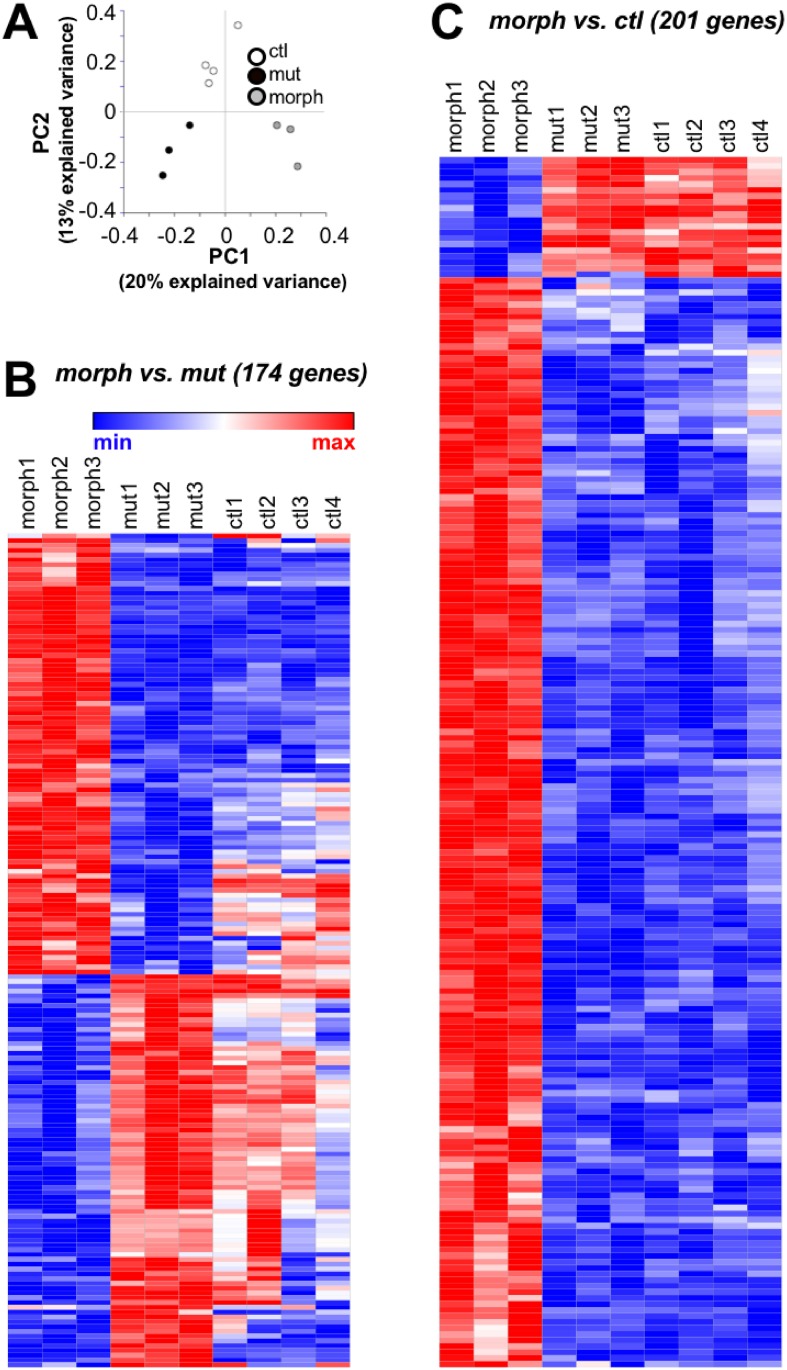
Fig 6. Microarray analysis revealed differential expression of gene in morphants compared to mutants or controls.
(A) PCA analysis of gene expression profiles of 48 hpf control (ctl), mutant (mut) and morphant (morph) transcriptomes indicated that they sort into three different groups on the basis of the first two principal gene expression components (PC1, PC2). (B, C) Heat map plots of differentially expressed genes. Each row indicates one of the 174 genes. Expression is normalized by row: blue, red and white indicate minimum, maximum and midpoint expression levels, respectively. The data have been hierarchically clustered by rows (genes). (B) 174 genes were differentially expressed in mutant compared to morphant transcriptomes. The heat map also included control gene expression levels for purposes of comparison. Many of the 174 genes had expression altered in opposing directions in mutants and morphants compared to controls. (C) 201 genes were differentially expressed in morphants compared to controls. For purposes of comparison, the heat map also included mutant gene expression levels.

