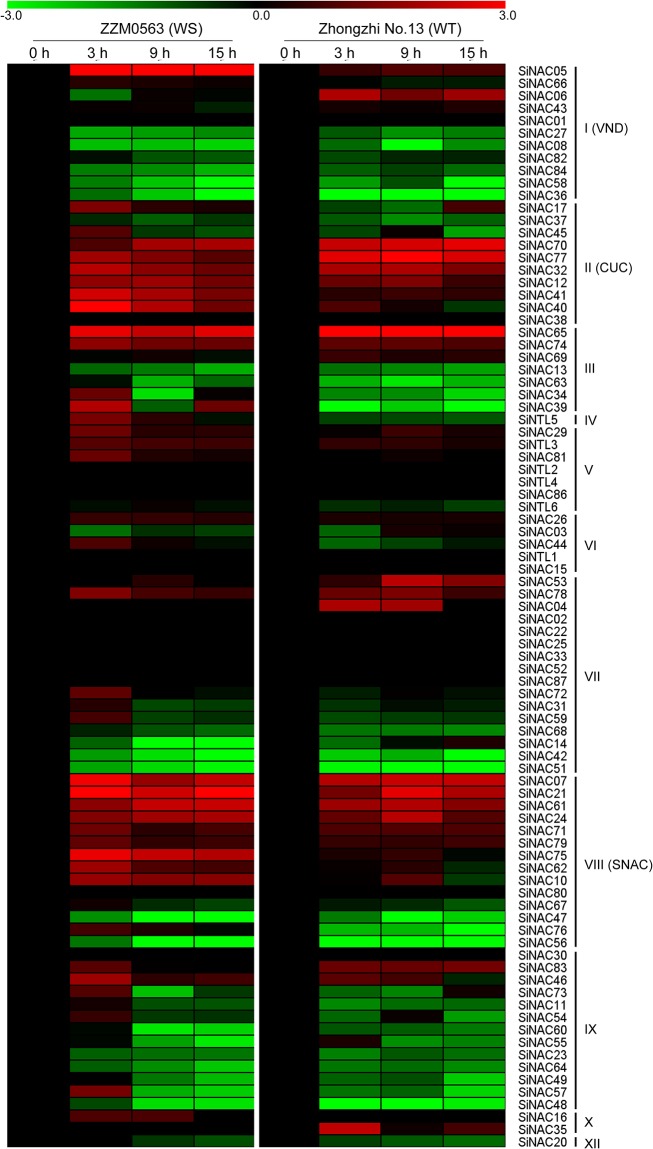
Fig 7. Expression profiles of SiNAC genes in roots of waterlogging-tolerant (WT) and waterlogging-sensitive (WS) cultivars after waterlogging treatment.
Log2-transformed values of the relative expression levels of the SiNAC genes under waterlogging stress were used to create the heat map. Changes in gene expression are shown in color as the scale.

