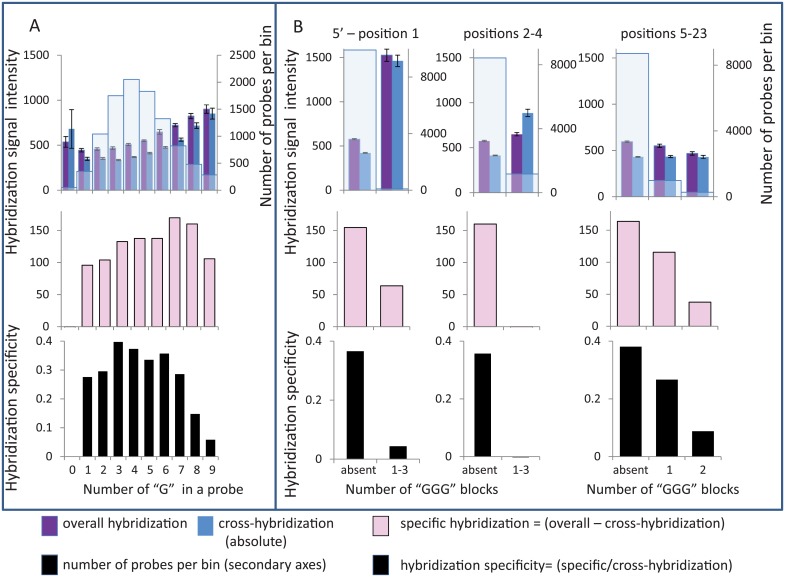
Fig 3. G-effects influence on hybridization specificity.
Categorization of oligoprobes according to numbers of G nucleotides (A) or GGG-blocks (B) is presented. Averaged hybridization signals were calculated for each bin and their values are shown along primary Y axes as columns of assorted colors. Overall (purple) hybridization and cross-hybridization (dark blue) are shown on the upper panels; specific hybridization (pink) is presented on the middle panels. Hybridization specificity (black), defined as ratio between specific and cross-hybridization, is presented on the lower panels. Numbers of the probes in each bin are shown along the secondary Y axes as light blue columns on the upper panels. A. Relationship between probes’ hybridization signals and the numbers of G nucleotides. B. Relationship between probes’ hybridization signals and the numbers of GGG-blocks in the positions of the probe. Probes were categorized into bins according to GGG-block counts in the probe’s positions from 1 to 23 (numeration from probe’s 5’ end). Location of GGG-blocks was assigned for three groups: for position 1, positions from 2nd to 4th, and positions from 5 to 23rd. The left histograms show averaged signals for probes with GGG-blocks located at the first position of the probe, middle histograms show results for probes with GGG-blocks located in the 2nd to 4th positions. The numbers of GGG-blocks in any position from the 5th to 23rd is presented on the right histogram.

