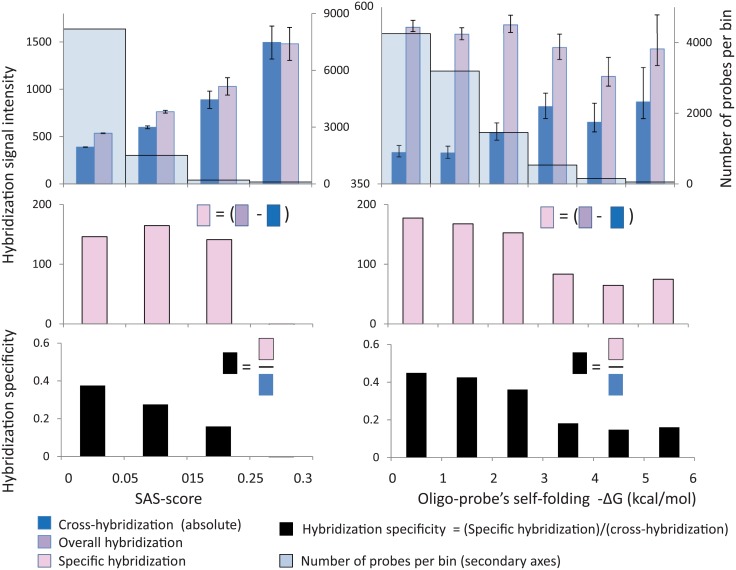
Fig 5. Nucleotide bias and folding potential affect hybridization specificity.
Oligoprobes were categorized into bins according to nucleotide bias (SAS-score, left panel) and self-folding vulnerability (right panel). Averaged hybridization signals are shown along the primary Y axis and numbers of probes in each bin are shown along secondary Y axes as light blue columns on the top histograms. Averaged values of overall (dark blue) and cross-hybridization (grey) signals are shown on the top histograms, specific hybridization (pink) is shown on the middle histograms and hybridization specificity (black) is present on the bottom histograms. Numbers of probes in each bin are shown along the secondary Y axis as light blue columns on the top histograms.

