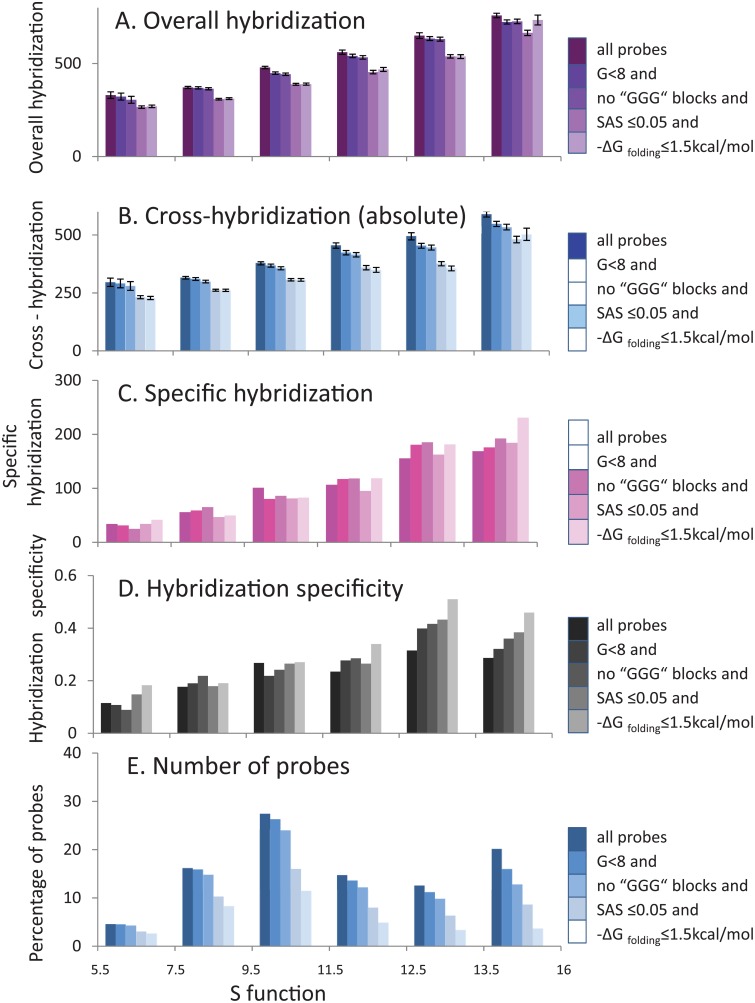
Fig 7. Categorization of probes by theoretically estimated S function after filtration using all analyzed parameters.
Oligoprobes were categorized into bins according to the estimated S function, where S is calculated as a combination of genomic occurrence of all k-mers (7 ≤ k ≤ 11) in an oligoprobe and their binding energy (see Material and methods for details). Averaged hybridization signals and other hybridization characteristics calculated for each bin are shown as columns of assorted colors depending on the bin type. The columns with variable shades of a particular color illustrate the filtration process that gradually removes from the database all probes with a defined sequence characteristic, which negatively affect hybridization specificity because of involvement in parallel hybridization reactions. Colors of the columns become lighter after each filtration step. The darkest columns represent all probes from the database, while lightest columns represent probes after all filtration steps. The filtration process entails the following sequential probe removal steps: 8 or more of G in a sequence, at least one GGG block, SAS score above 0.05, -ΔG folding above 1.5 kcal/mol. A. Overall hybridization (derived from the probe’s dataset with specific targets). B. Cross-hybridization (absolute) (derived from the dataset of probes without specific targets). C. Specific hybridization (represented by subtraction values between overall and cross-hybridizations). D. Hybridization specificity (represented by ratio between specific and cross-hybridization). E. The percentage of probes (from complete dataset) in each bin.

