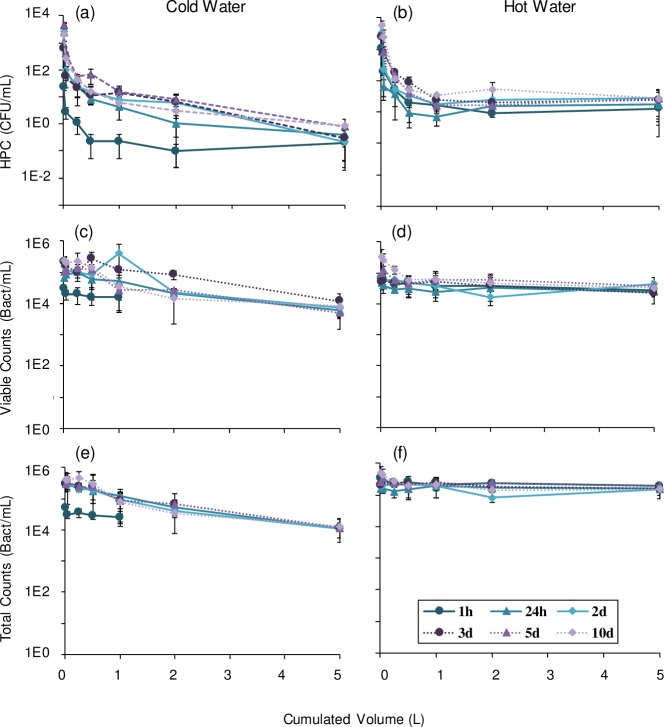
Fig 2. Mean HPC, viable and total cell count profiles from 2 taps for different stagnation times.
Mean bacterial loads in water were evaluated in successive volumes of cold and hot water sampled from 2 taps. In cold water, (a) culturable, (c) viable and (e) total cells were plotted for stagnation time of 1 hour, 1, 2, 3, 5 and 10 days. Results measured in hot water are also shown for (b) culturable, (d) viable and (f) total cells.

