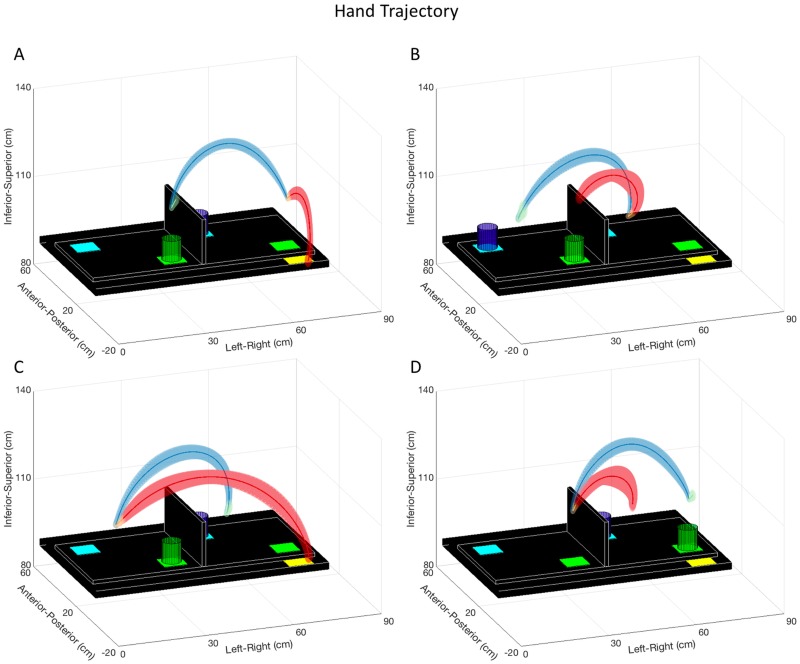
Fig 3. Cup Transfer Task hand trajectory.
Hand trajectories for the Cup Transfer Task. The group average hand trajectory is plotted as a dark line, and the standard deviation of participant means as three-dimensional shading. Movement 1 (A), Movement 2 (B), Movement 3 (C), and Movement 4 (D) are segmented into reach (red), grasp (orange), transport (blue), and release (green) phases. The maximum of the mean three-dimensional standard deviation was calculated for reach-grasp and transport-release segments for each movement to quantify variability, reported in Table 3.

