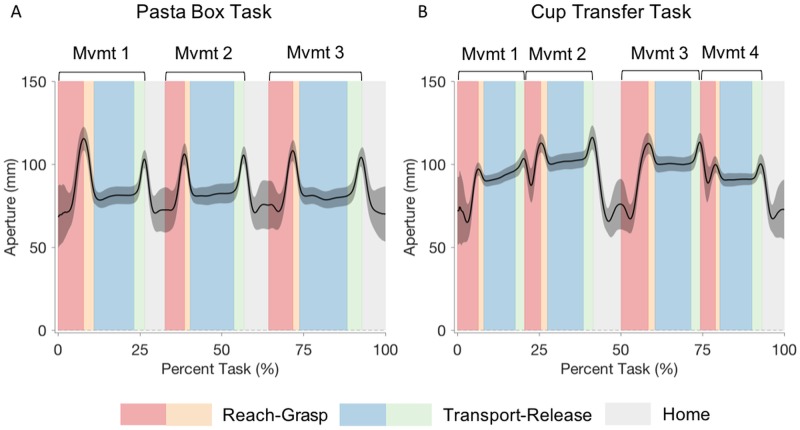
Fig 5. Grip aperture.
Grip aperture graphs for Pasta Box Task (A) and Cup Transfer Task (B). The solid line represents the group average, and grey shading represents the standard deviation of participant means. The task is segmented into reach (red), grasp (orange), transport (blue), and release (green) phases for each movement, with light grey representing the return to “home” phase. Kinematics of the reach-grasp segment and the transport-release segment were analyzed together.

