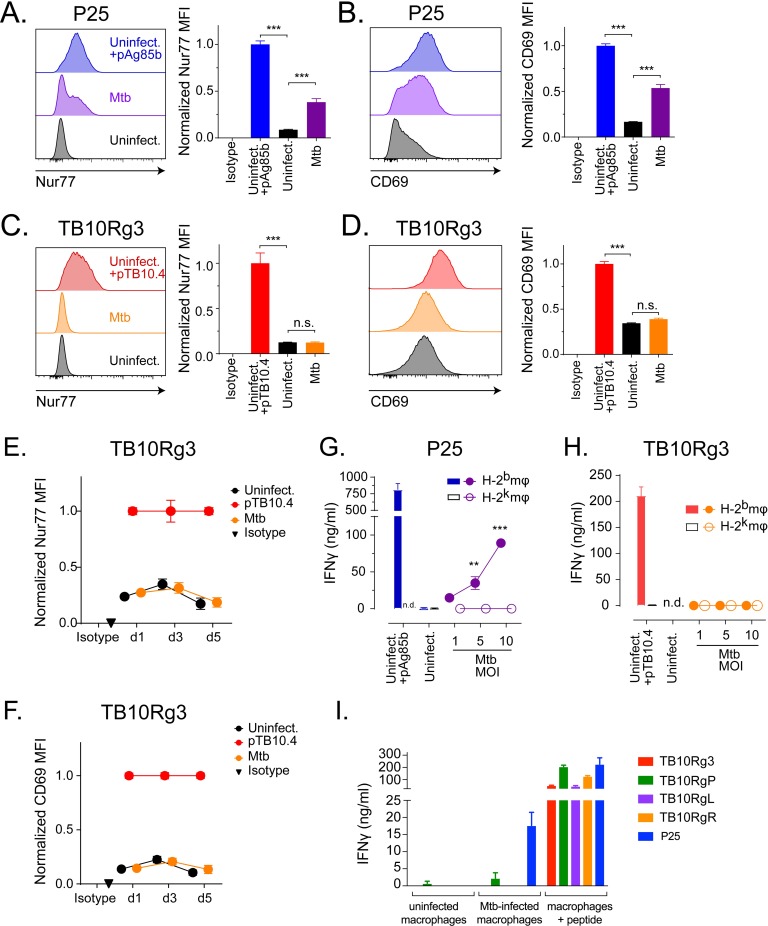
Fig 3. Ag85b-specific CD4+ T cells, but not TB10.4-specific CD8+ T cells, recognize Mtb-infected macrophages.
(a-d) T cells were co-cultured with peptide-pulsed, Mtb-infected (at MOI 1, 5, or 10), or uninfected macrophages for 2 hours. (a) Representative histogram of Nur77 expression in P25 T cells and the normalized Nur77 MFI. (b) Representative histogram of CD69 expression in P25 T cells and the normalized CD69 MFI. (c) Representative histogram of Nur77 in TB10Rg3 T cells and the normalized Nur77 MFI. (d) Representative histogram of CD69 expression in TB10Rg3 T cells and the normalized CD69 MFI. (e-f) TB10Rg3 T cells were co-cultured with uninfected, peptide-pulsed, or Mtb-infected macrophages for 2 hours on d1, d3, and d5 post infection. Normalized expression of (e) Nur77 or (f) CD69 by TB10Rg3 T cells. P25 (g) or TB10Rg3 (h) T cells were co-cultured with uninfected, peptide-pulsed, or Mtb-infected macrophages, and IFNγ production was measured after 72 hours. (i) TB10Rg3, TB10RgP, TB10RgL, TB10RgR, or P25 T cells were cultured with uninfected, Mtb-infected, or peptide-pulsed macrophages. After 3 days, IFNγ in the supernatants was measured. Figures are representative of at least 5 (a-d, TB10Rg3), 2 (a-d, P25), 3 (e-h), or 2 (i) experiments. Statistical analysis was done by one-way ANOVA with Dunnett posttest (a-d) or two-way ANOVA with Sidak posttest (g-h). *, p<0.05; **, p<0.01; and ***, p<0.005.

