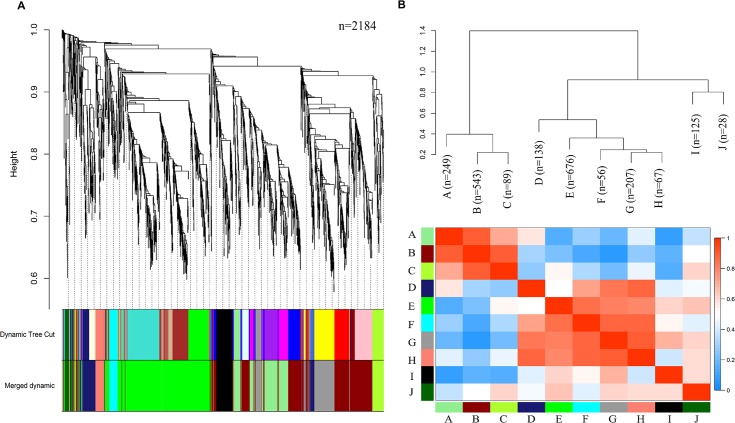
Fig 1.
a) Gene dendrogram after dynamic tree cut and after dynamic merge. b) Visualization of the eigengene network representing the relationships among the modules and the trait weight. The top plot shows a hierarchical clustering dendrogram of the eigengenes. The heat map in the bottom plot shows the eigengene adjacency. Merge cut-off was set at 0.2.

