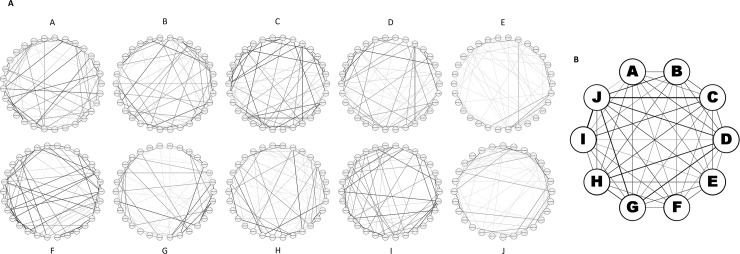
Fig 4.
a) Intramodular network of top 30 genes in optimal (A, B, C), stressed (E and F), general response (D, G, H) and time associated modules (I, J). Figure letters correspond with module letter. Thickness of lines represent strength of connections. b) Intermodular network of 10 modules. Thickness of lines represent strength of connections.

