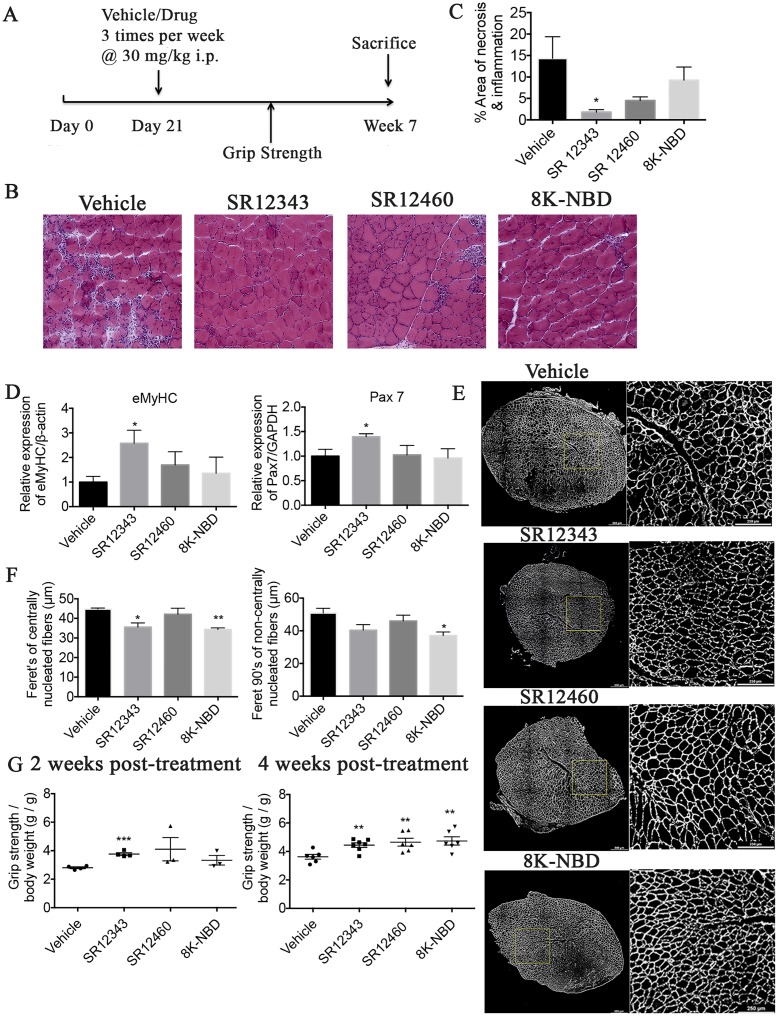
Fig 7. NBD mimetics improve muscular pathology and grip strength in mdx mice.
(A) Shown is the treatment regimen with NBD mimetics in mdx mice. (B) Hematoxylin–eosin staining of TA muscle from 7-wk-old, treated or untreated mdx mice. Images were taken at magnification of 20×. Representative images were shown for each treatment group. (C) Quantitation of the percentage of area exhibiting necrosis or infiltration by using Image J. (D) qRT-PCR analysis of eMyHC and Pax7 in TA muscle. (E) TA muscle from 7-wk-old, treated or untreated mdx mice was stained with laminin by IHC to outline myofibers. Overall images of TA muscle were shown on the left side, and the inset panel images were shown on the right side. (F) Quantitation of minimum Feret diameter in centrally and noncentrally nucleated myofibers. (G) Forelimb force determined by grip strength test. Five-wk-old (2 wk post treatment) and 7-wk-old (4 wk post treatment) mdx mice, treated or untreated, were tested for forelimb grip strength. Five sequential tests were performed, and the force was normalized to body weight. Data were shown as mean +/− SEM. Dosages used are as follows: SR12343 (30 mg/kg), SR12460 (30 mg/kg), and 8K-NBD peptide (10 mg/kg). n = 6–7 each group. *P < 0.05, **P < 0.01. Underlying data can be found in S1 Data. eMyHC, embryonic myosin heavy chain; IHC, immunohistochemistry; NBD, NEMO-binding domain; NEMO, NF-κB essential modulator; Pax7, paired box protein 7; qRT-PCR, quantitative real-time polymerase chain reaction; TA, tibialis anterior.

