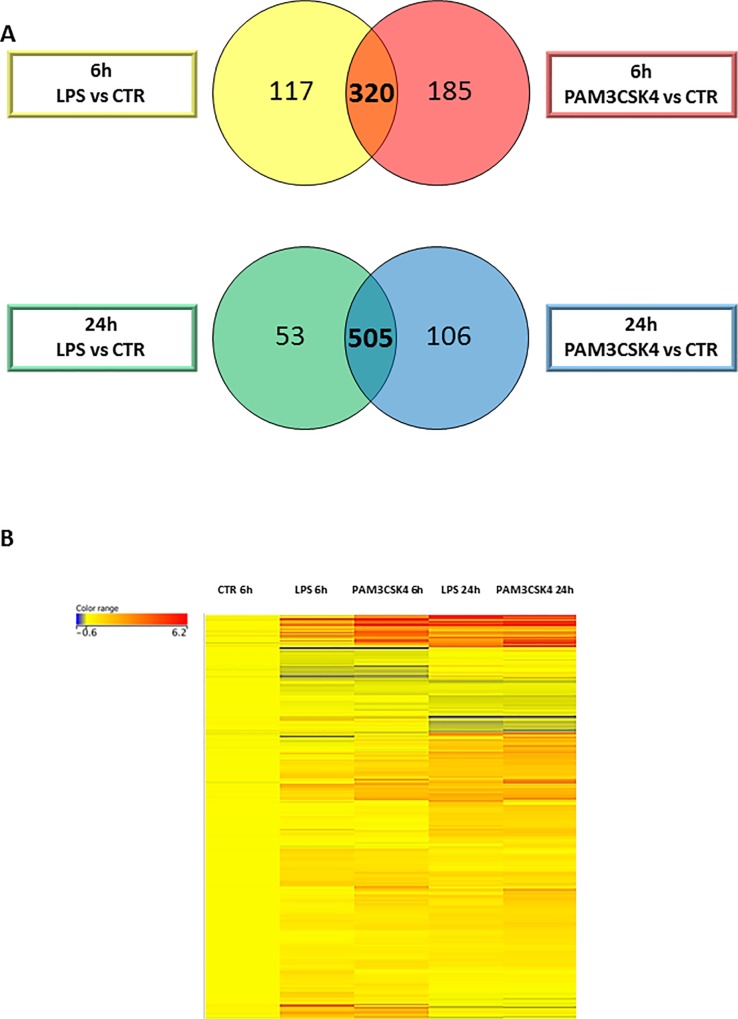
Fig 2. TLR1/2 and TLR4 pathways induce similar changes in the gene expression profile of SZ95 sebocytes.
(A)Venn diagram visualizing genes that are regulated both by PAM3CSK4 and LPS in SZ95 sebocytes at 6 (orange) and 24 hours (dark blue). Note the large number of genes that are regulated by both stimuli at 6 hours and an even greater number at 24 hours. (B) Differentially expressed genes in untreated, LPS or PAM3CSK4 treated SZ95 sebocytes at 6 and 24 hours as observed by our RNAseq analysis shown as a heat map. Color intensities reflect the ratios of signal intensities as shown. Note that the detected changes were due to a sustained up-regulation in the vast majority of genes, while no genes with a significant down-regulation at both time-points were detected.

