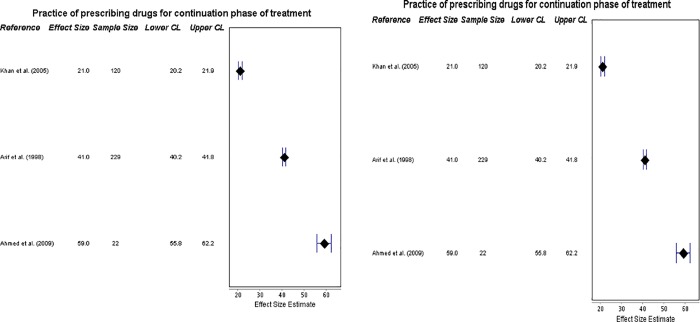
Fig 4. Forest plots on prescriptions for intensive and continuation phases.
(a) Forest plot visualizing data on practitioners’ compliance with prescribing drugs for the intensive phase of TB treatment (ISTC Standard 8). CL = 95% Confidence Level. (b) Forest plot visualizing data on practitioners’ compliance with prescribing drugs for the continuation phase of TB treatment (ISTC Standard 8). CL = 95% Confidence Level.

